Dear Expert,
I want to change the axis range from -1 to 1 while the current axis is 0 to 1, when I change my bottom custom axis from -1 to 1 plot was shiting and not showing the same plot with the custom axis, could you help me to figure out.
Hi @Chhotelal
You can find all the control for custom axes on the properties panel.
Please experiment with it and let us know what is working or not for you.
Best,
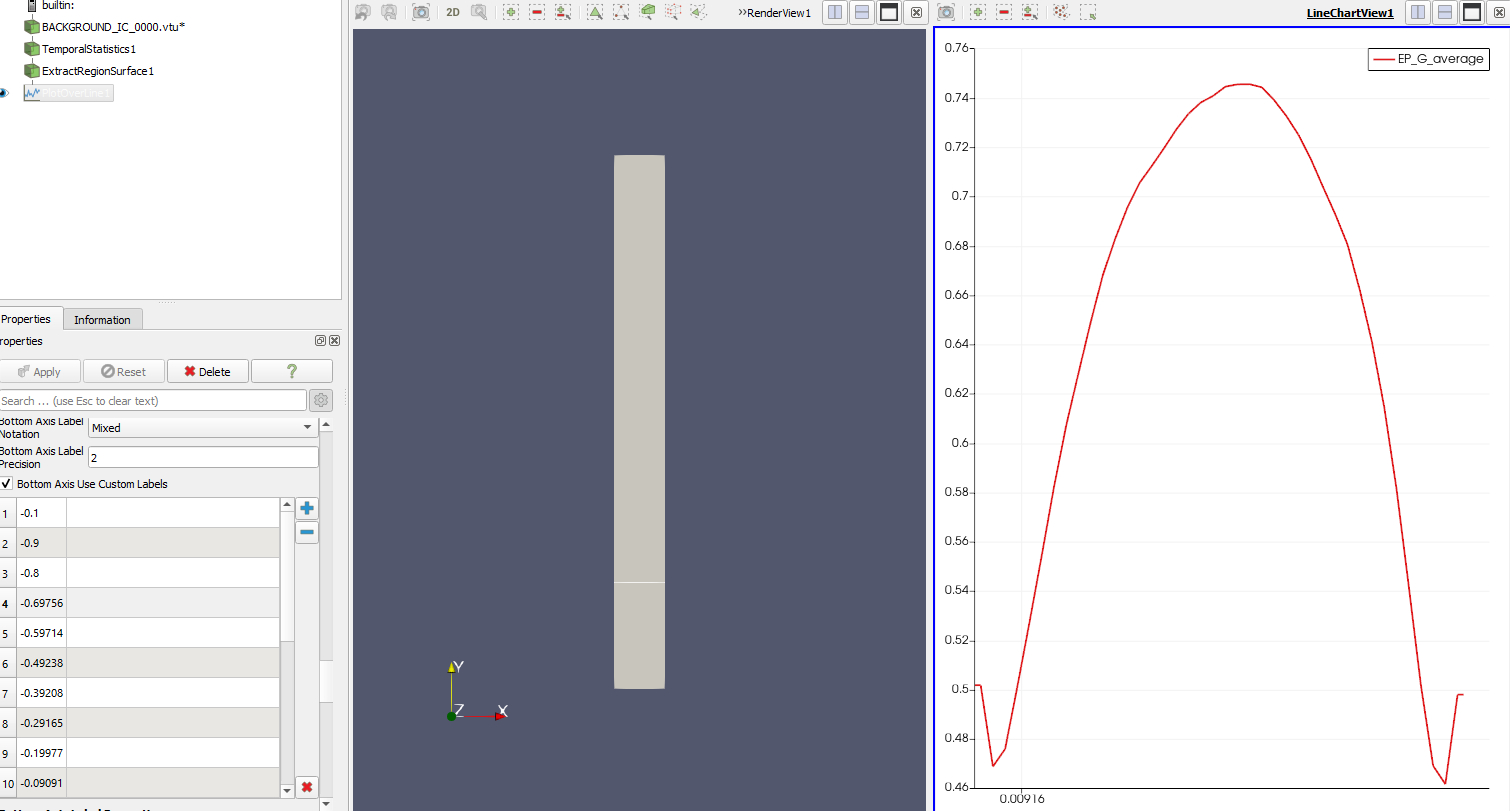
@mwestphal, I tried but the bottom axis is not converting, you can look it up below.
My geometry size is 0 to 0.095
@Chhotelal I think we are confused about what you are asking. These Q&A tend to be easier when you provide data and instructions on how to reproduce what you are seeing in addition to a description of what you want to see.
If I understand your question, it sounds like you want to rescale the numbers on the X-axis without actually rescaling the curve of the plot. Put another way, you want to arbitrarily write numbers in the X-axis that might not have any relevance to the data being plotted.
In short, ParaView won’t let you do that. If it writes a number on the X-axis, it will only place that to correspond to that location in the plot. If you want to change the scale, you will have to either rescale the data or add a field of the appropriate scale to use for the X locations in the plot.
Based on the screenshot you gave, probably the easiest way to do this is to use the Transform filter before the Plot Over Line filter. To rescale the X bounds from [0,0.095] to [-1, 1], set the Scale to [21.05,1,1] (where 21.05 \approx 2/0.095) and set the Translate to [-1,0,0].
@Kenneth_Moreland , Thank you for your reply, but this is not changing, could you check it.
BACKGROUND_IC_0021.vtu (567.5 KB)
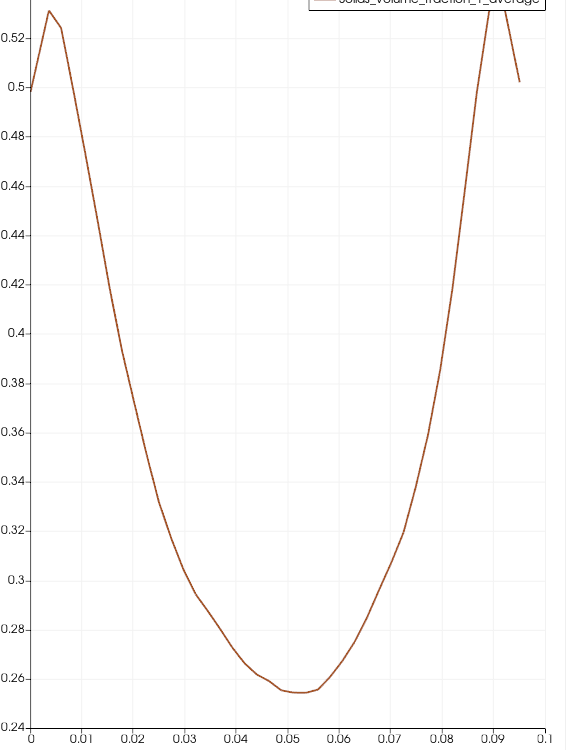
I want to plot Epg at x=(0,0.15) , y = (0.2, 0.2)
while x-axis rescale to write (-1 to 1).