Hello,
I’m new user for Paraview. Currently, I’m using the paraview to visualize my research project’s microstructure, by using the threshold, I can visualize the structure I want. I also showed the threshold setting below.
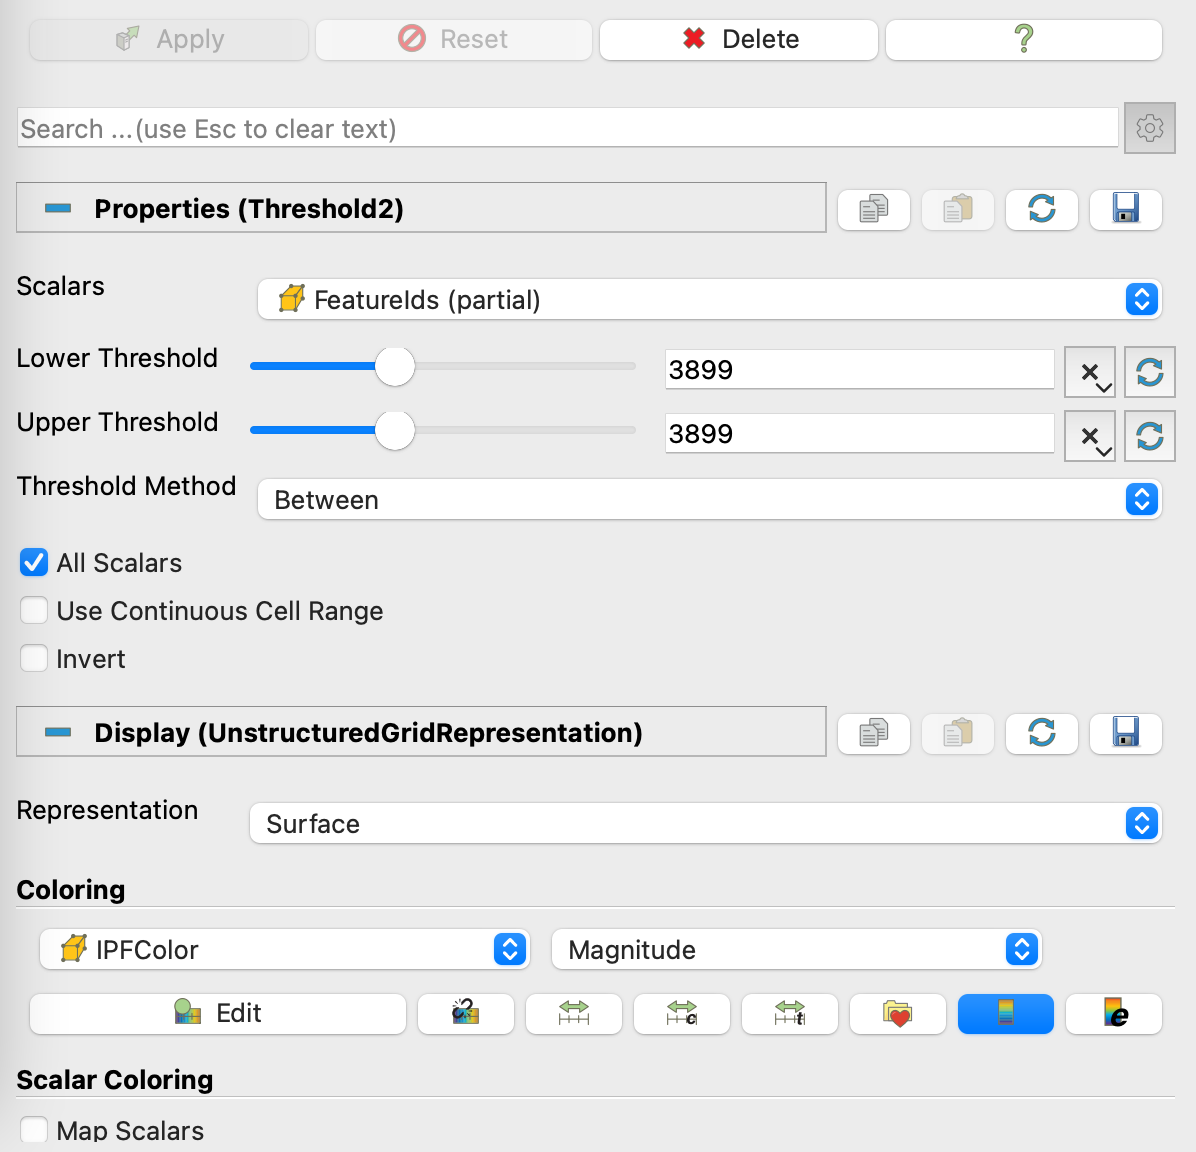
I know how to use the threshold to visualize the individual stuff by using its unique ID (in this case FeatureID), or visualize a continuous set of stuff by setting the range of the ID value. However, how can I visualize some stuff that don’t have a continuous list of IDs? For example, if I have a .csv file that contains some IDs like 12, 16, 199, 1000, etc. Do I have a chance to visualize them all at once without manually put thresholds for each individual IDs?
Best,
Zipeng(Perry) Xu