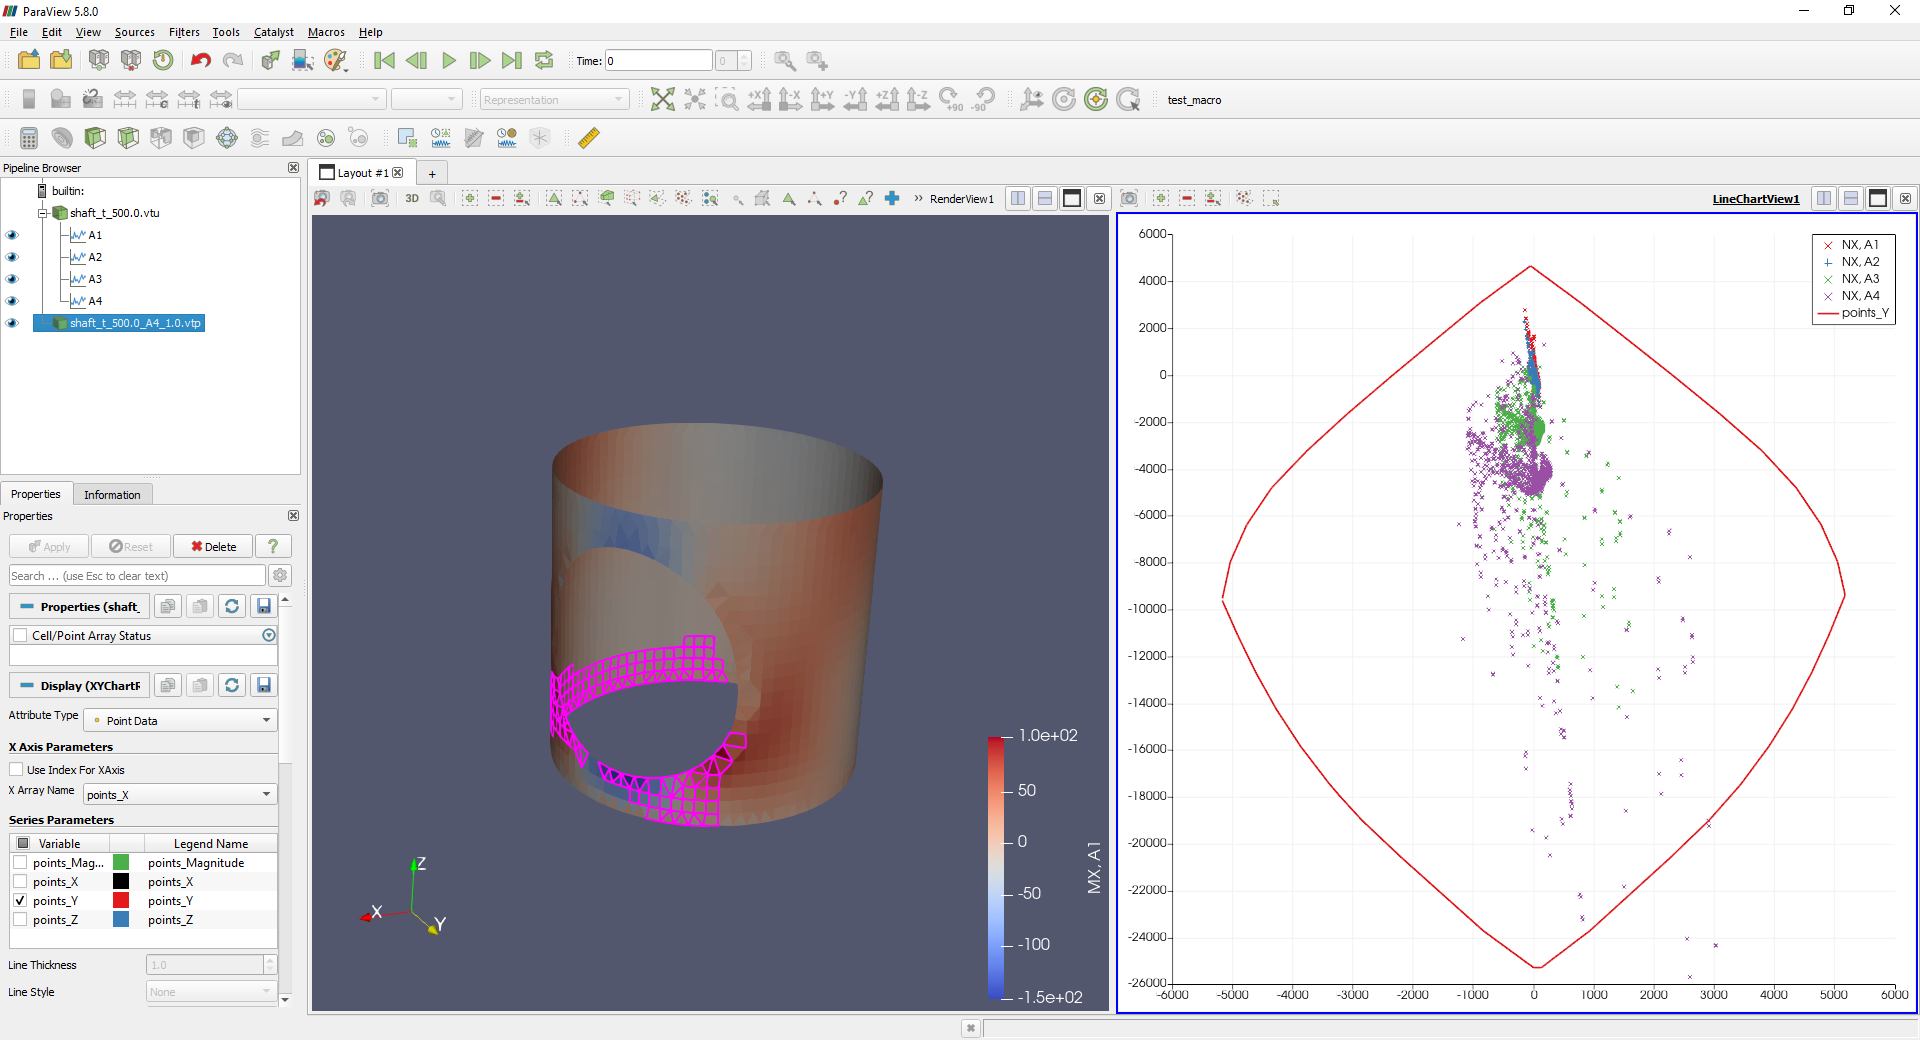
I have two sources open in Paraview. The first is an unstructured VTK grid that defines a surface with data for each of the cells. The second source is a VTK polyline that defines the capacity for the cells.
I am plotting both sets of data to visualize which data points are within the envelope (polyline) and which are outside.
I am new to Paraview and am struggling with selecting data when multiple sources are active. The linked selection between the RenderView and LineChartView works when I have one source active in LineChartView but fails when I have both sources active (see the screenshots below).
I would like to be able to exclude the polyline source from the selection so that when I select points or cells they are highlighted in the other visualization panel. Currently the polyline source appears to be preventing the selection tool from linking selections between the two panels.
If there is a better file format than .vtu and .vtp I am also open to that, but even by adding a programmable filter to the VTU source it breaks the selection tool.
Thanks for the quick turnaround. Is there a file format that would be better suited to storing these different types of data in a single source so that I don’t run into this issue?
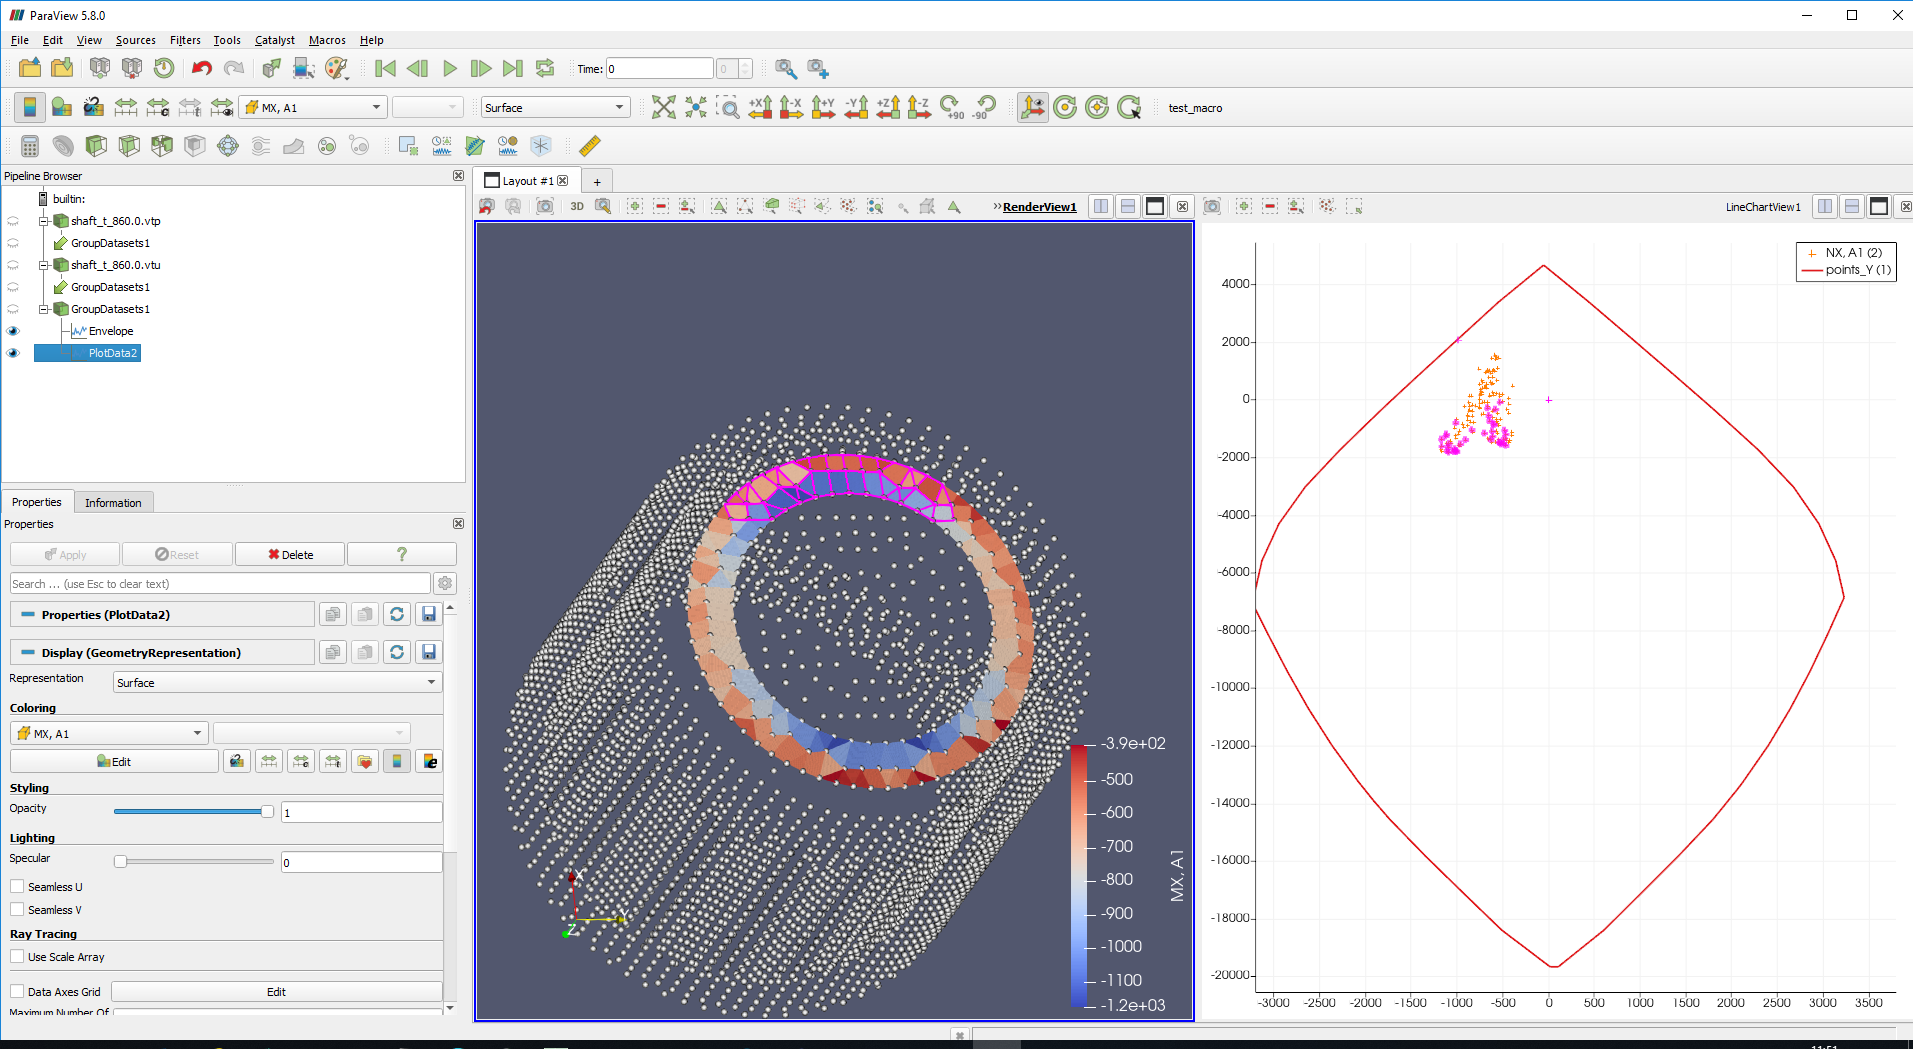
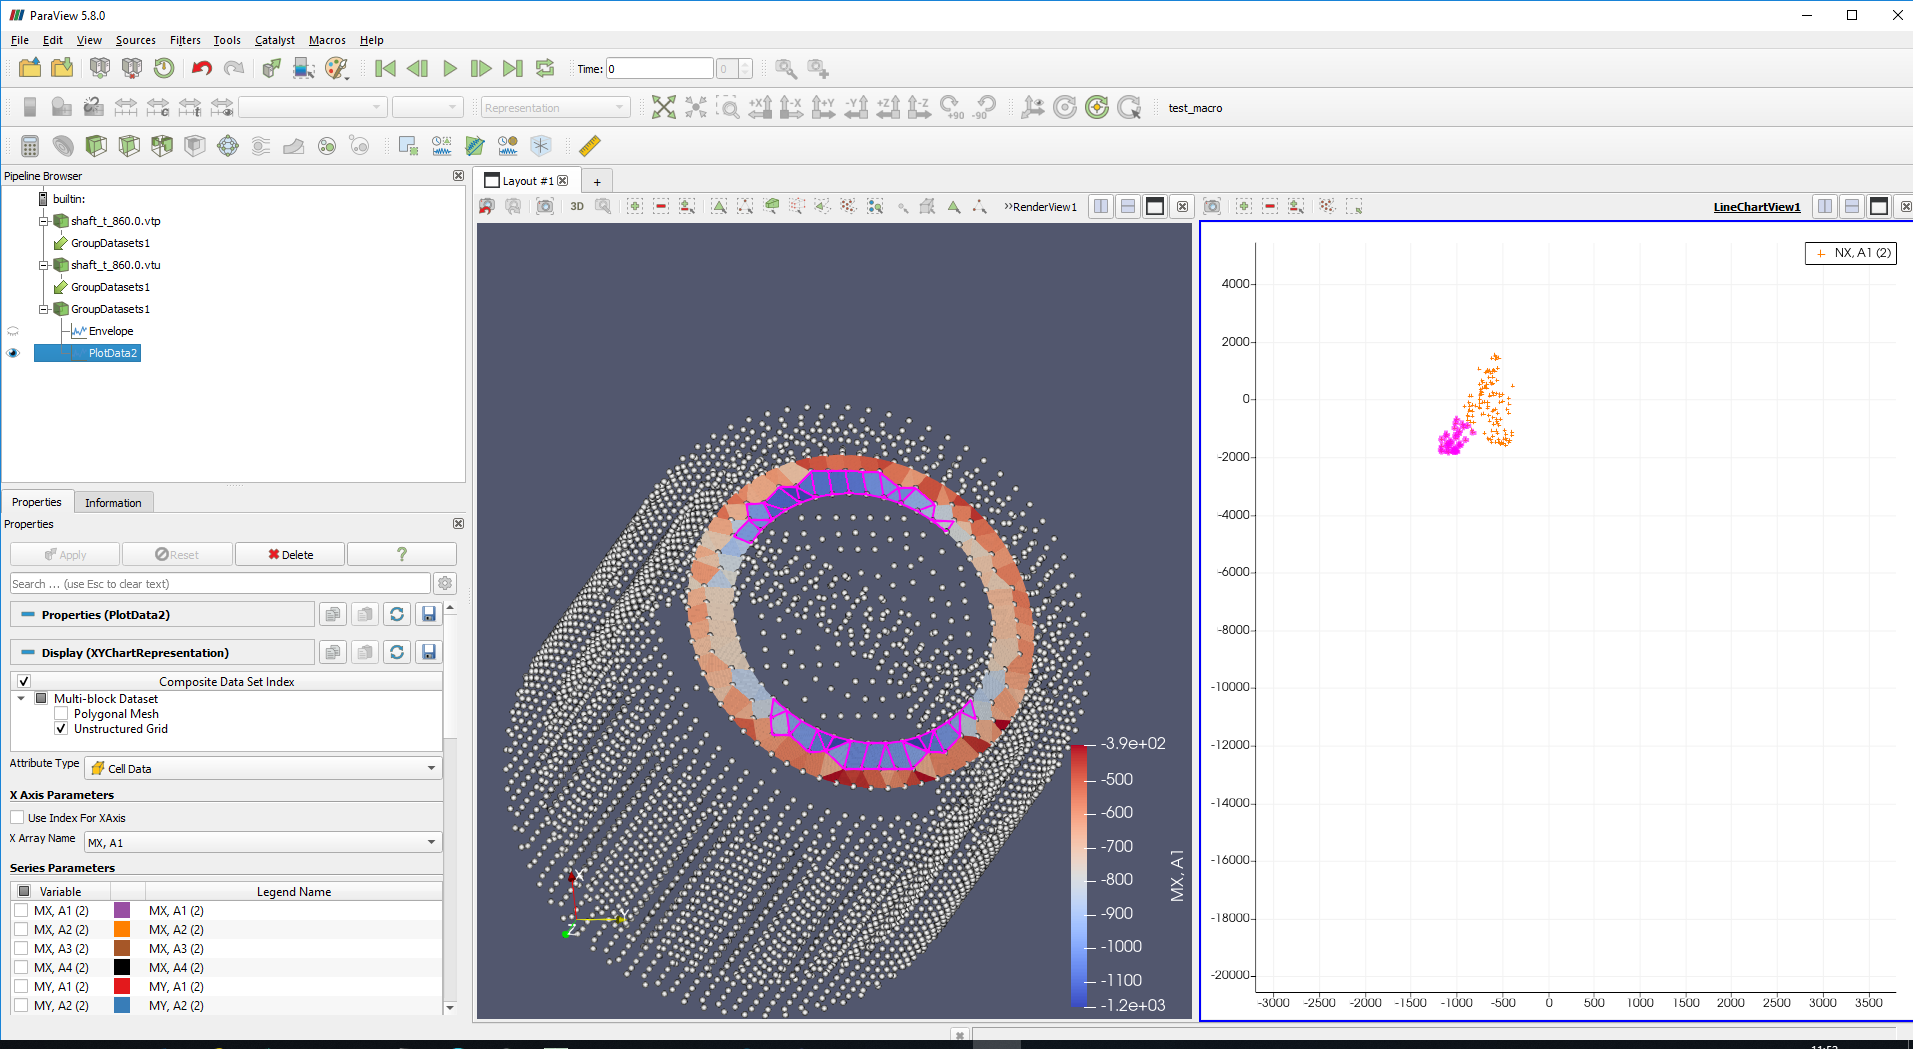
The GroupDataSets partially worked. I can select from the RenderView and get points highlighted on the LineChart, but the reverse does not work when the envelope line is active.
Select on RenderView, selection properly shows in LineChart:
Ah, ok maybe this won’t work then. The data I am plotting are pairs of [X,Y] so the X Array Name is different for every set of data. The x coordinates are independent from each other. For example, one set of data might be x coordinates from array MX A1, y coordinates from array NX A1. Another set would be x coordinates from array MX A2, y coordinates from array NX A2.
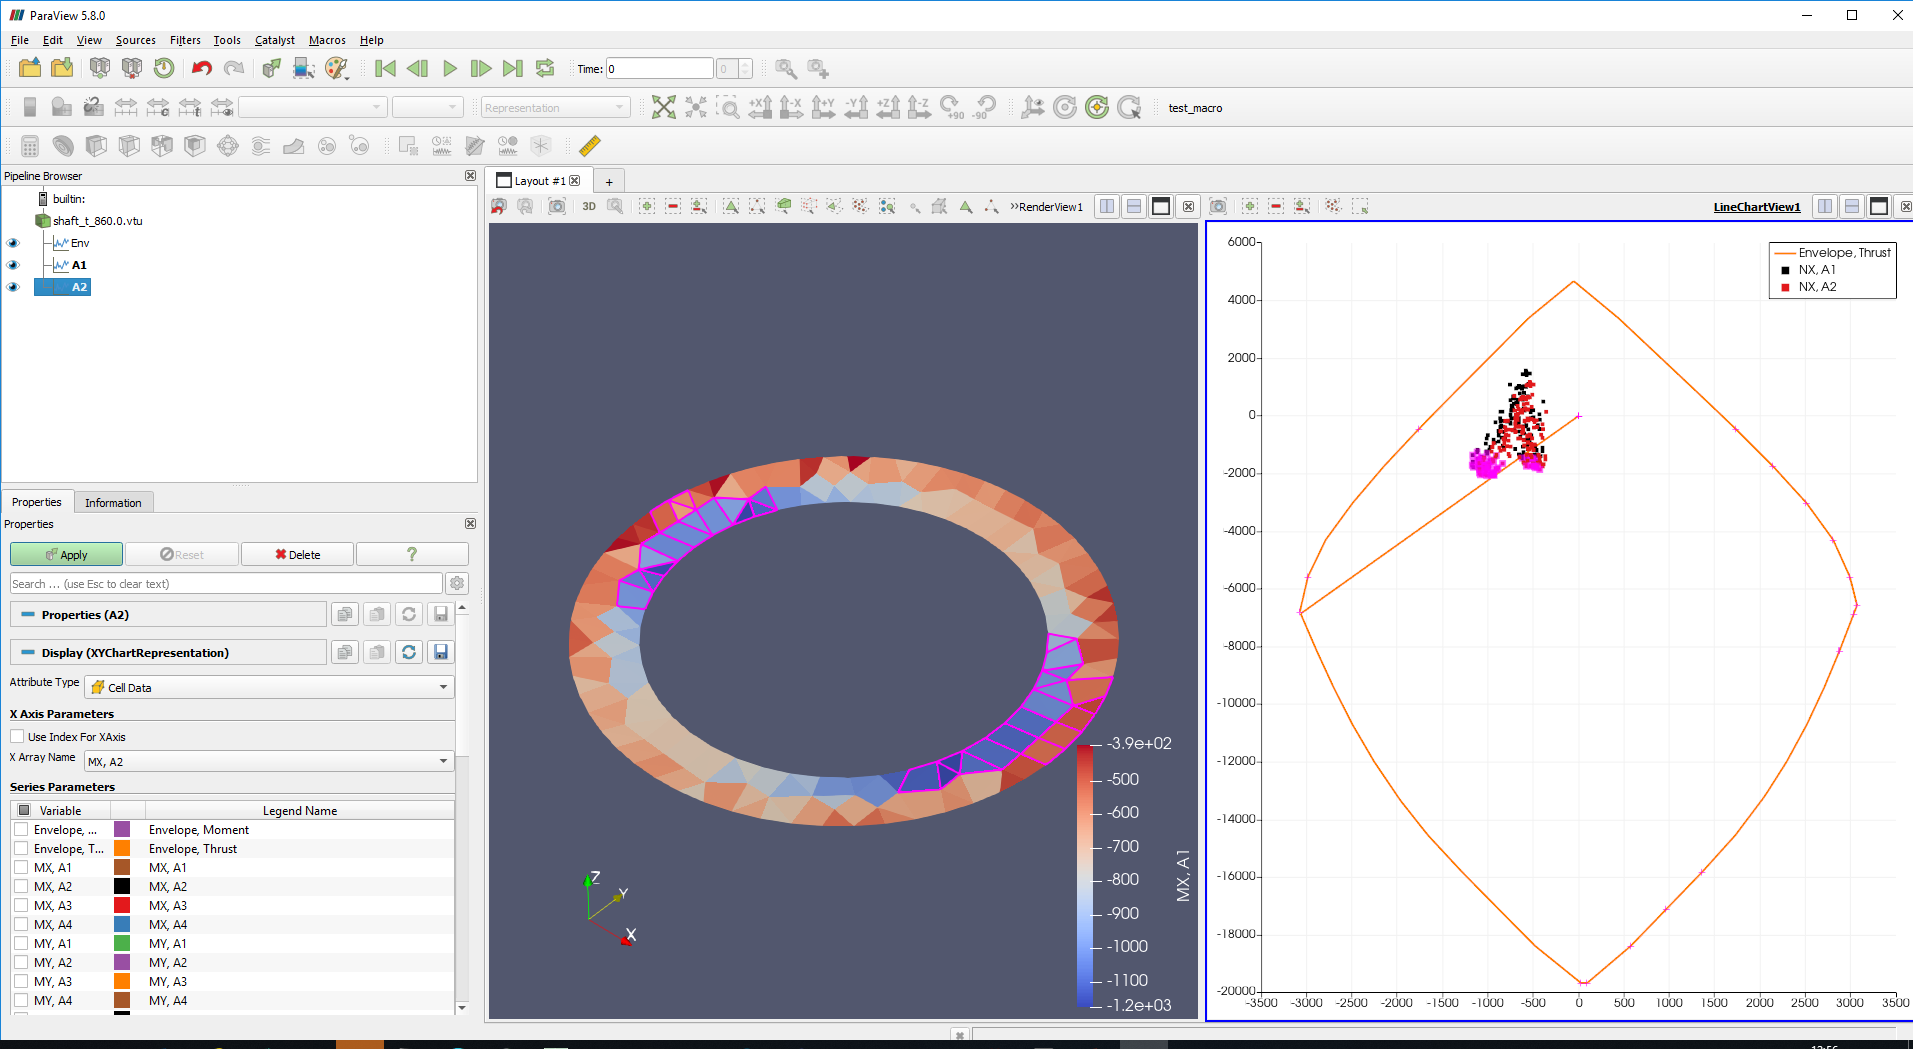
Thanks for all the help. I think I can acheive my goal by includes the envelope in with the VTK unstructured grid file and padding the arrays with a number so they are all the same length. A bit hacky, but it should work: