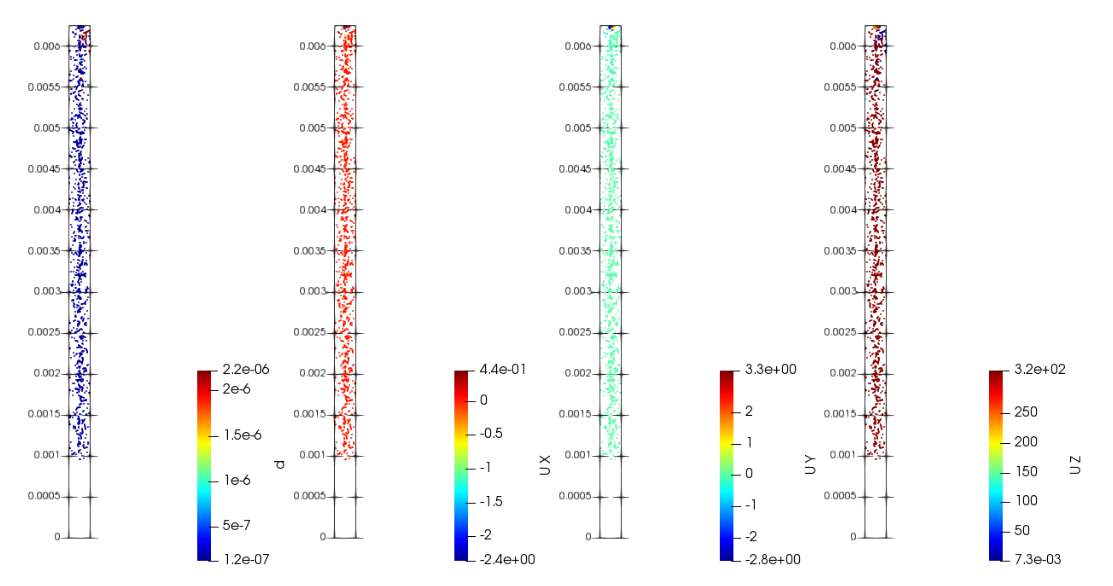
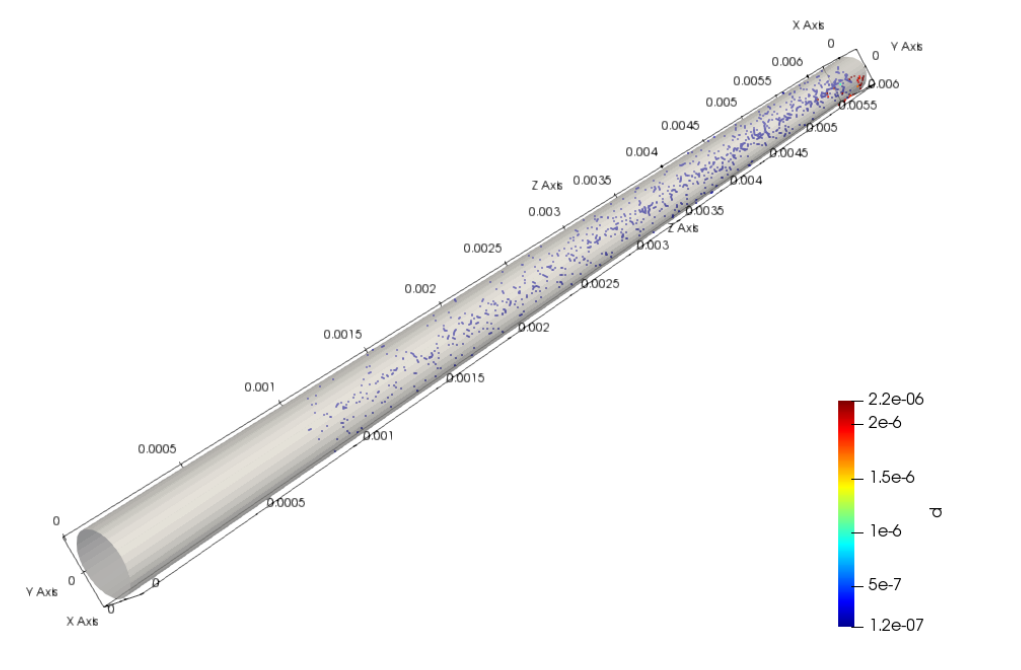
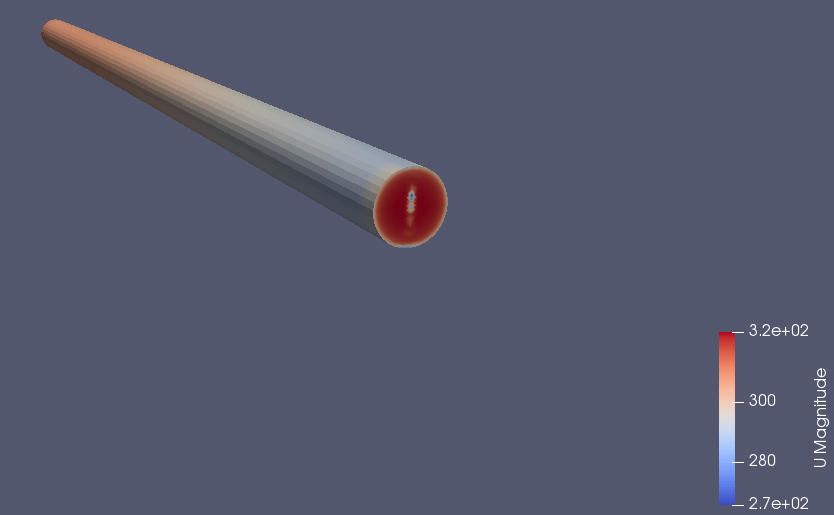
I am currently working on a code in openFOAM which simulates a spray through a cylindrical tube. I have successfully imported the data into paraview but am having trouble creating the types of images and graphs that I want. Attached below are examples of what I am trying to create. The dots represent the spray droplets with UX UY UZ being velocity and d being diameter. I have a multi-block data set.
I am using Paraview 5.4.0 64-bit (Legacy Rendering Backend) and am in a position where I cant use any other version. Any guidance or assistance on how I would recreate these images would be greatly appreciated.
Hi I have received this case from someone else for my thesis and it deviates a lot from the tutorials, but it uses the sprayFoam solver within openFOAM which I believe is the aachenBomb tutorial.
Good luck
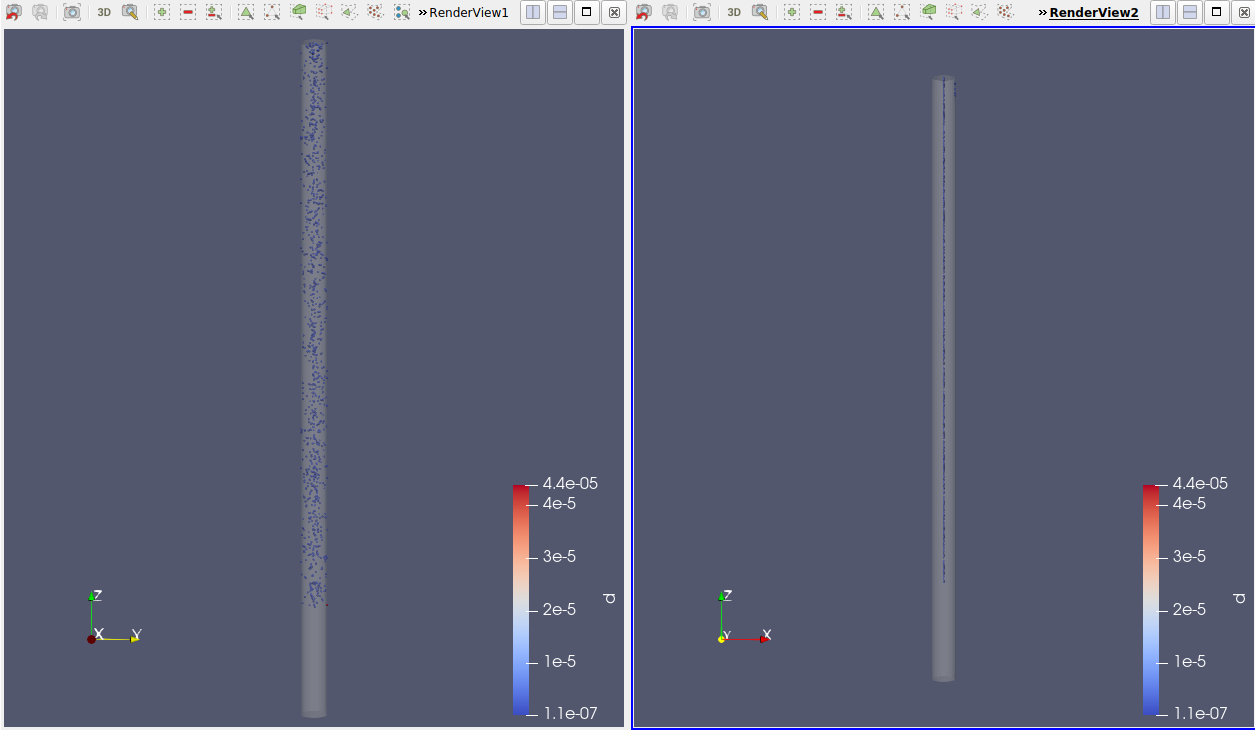
Update on this, my issue was that the Lagrangian data was not being displayed. I have solved this by converting the data to VTK format using the foamToVTK conversion with the mpirun command as my code was run on multiple processors. I now have the lagrangian data displayed, but the positions of the data is incorrect. Below you can see that the data is mainly located on the z-y plane when it should be displaying throughout the volume of the cylinder:
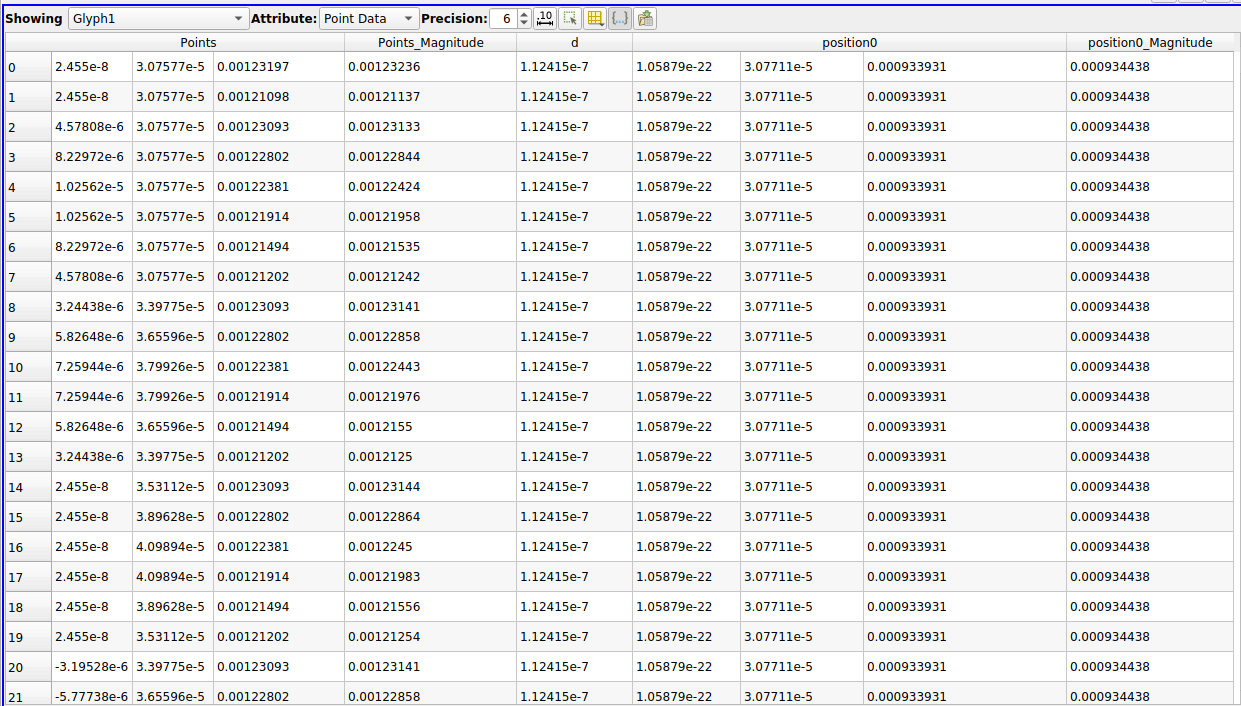
From the spreadsheet view you can see that all of the x-coordinates in the Position0 heading are all really small numbers (1x10^-22) which is why the data is mainly on the z-y pane. However the position coordinates under the points heading are distributed throughout the volume of the cylinder.
I’m not sure why the data is displaying the way it is:
could it be an issue with how the data was converted to VTK format?
should the position of the lagrangian data be determined by the position0 heading or points heading?