Hey,
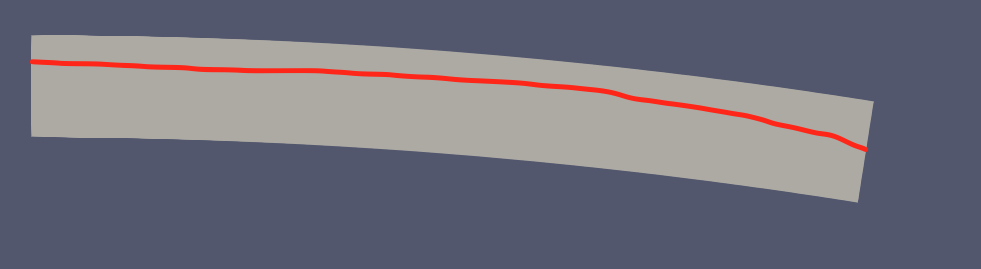
I want to simply add a reference line in my model like the following (where the line is hand-drawn):
I have x, y, z coordinates of the line, and from what I can find about pyvtk it seems pyvtk.RectilinearGrid is a good choise, so I have the following python code:
vtk_file = destDir + "example.vtk"
exampleCurve = pyvtk.RectilinearGrid(x,y,z)
vtk = pyvtk.VtkData(exampleCurve,"")
vtk.tofile(vtk_file,'binary')
When I open the vtk file produced in paraview, the following is what I get.
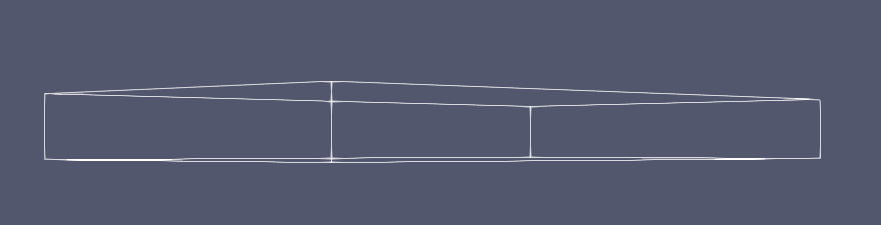
It seems I can only view this as an outline, and if I click any other forms of representation, ParaView immediately crashes.
Please note that I simply wanted to plot a structure, so pyvtk.VtkData(exampleCurve,"") does not provide any field data on to the curve.
I have two questions now.
-
What is the best way to plot a reference line/curve or any structure without field data in paraview?
-
What is a good reference to learn more about pyvtk. I didn’t find any good resourced or even documentation online.
Thanks!