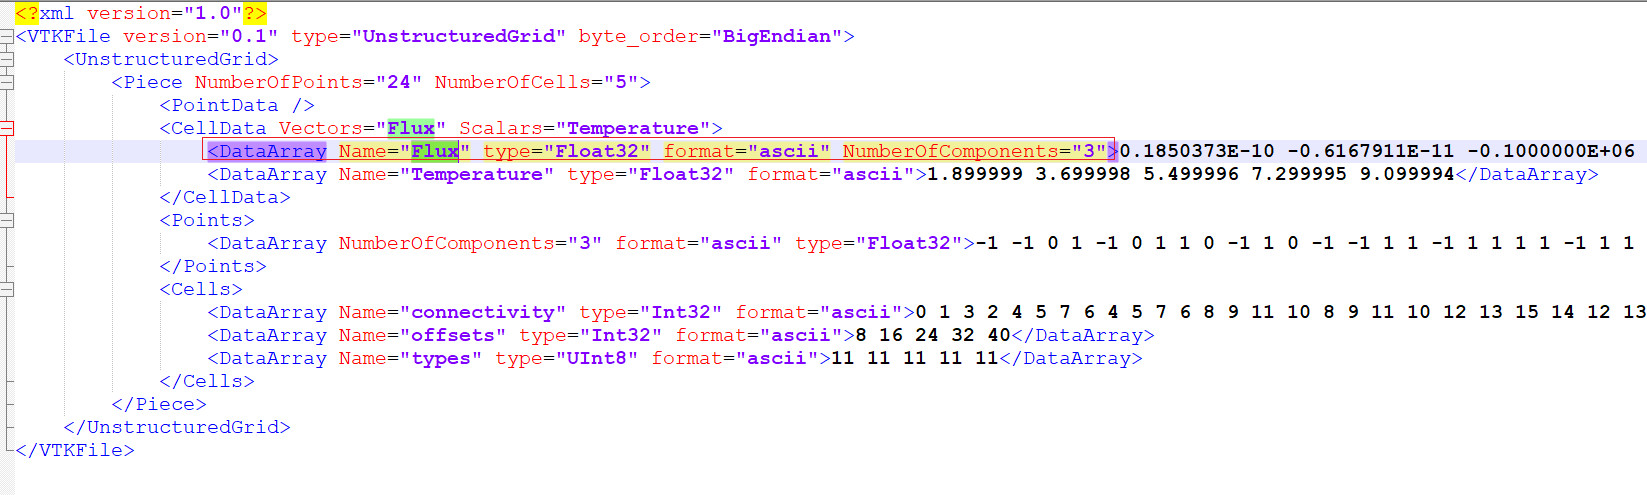
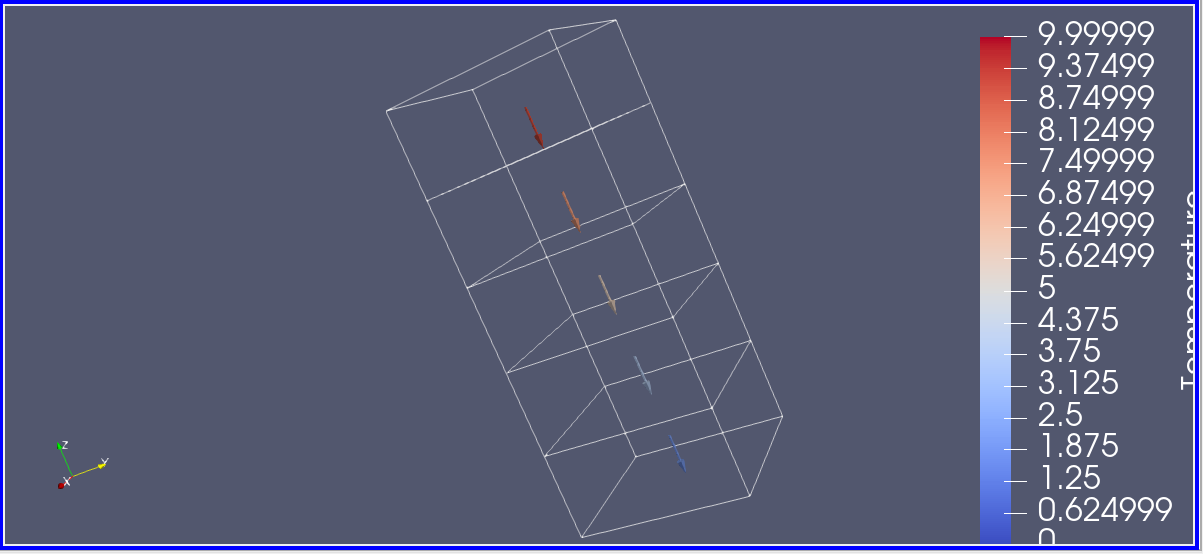
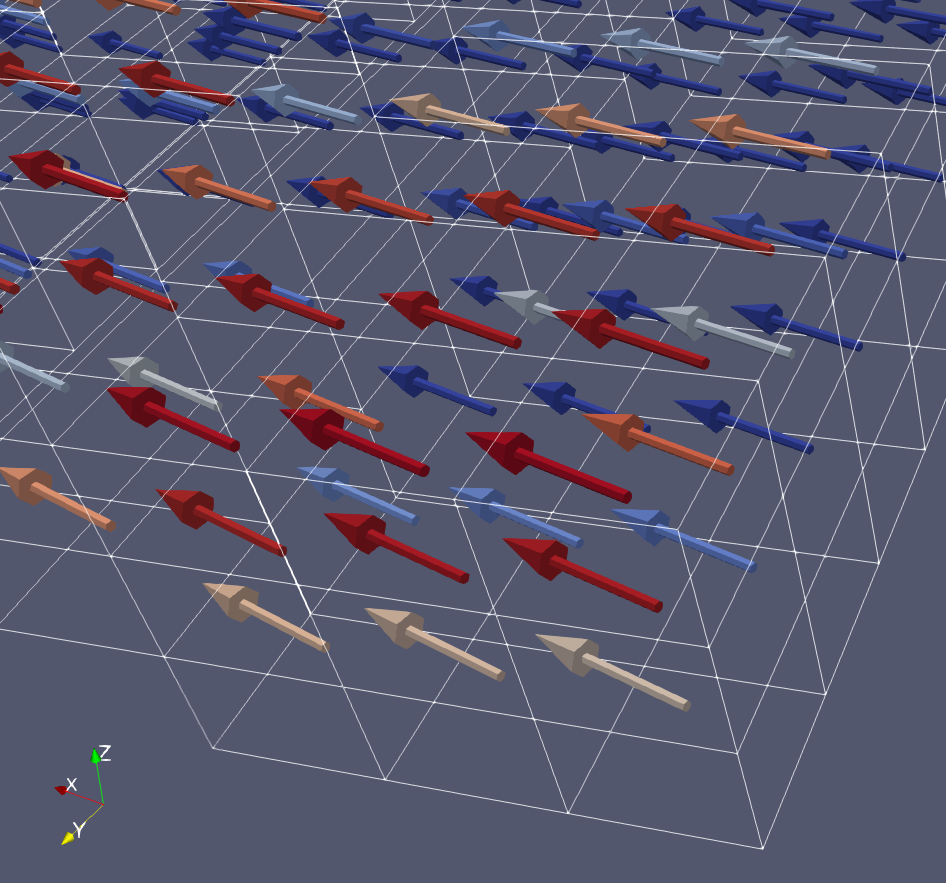
When we draw the CellData vector flux on the corresponding XYZ coordinates,use the glyph filter to generate and visualize arrows or other glyph geometry at each point.The effect is shown in the figure below。
But this effect is not in line with our requirements. We hope that the arrow of flux will be associated with the geometric size of element. The length of the arrow should be 0.7 to 0.9 based on the line segment between the vector and element.
What shall I do? Can I set it through paraview software?
Now I have calculated the intersection of vector flux and elements through C + +. How can I express it in VTK file to display it correctly in paraview?
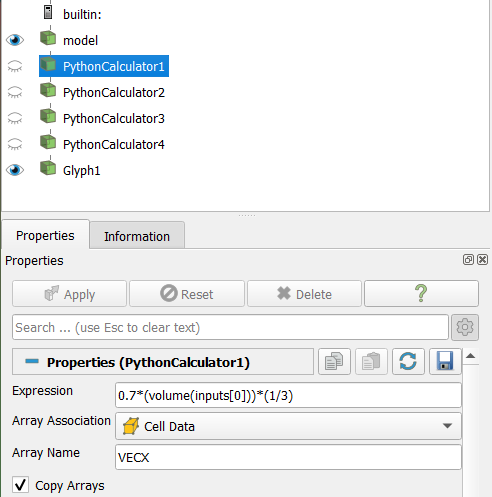
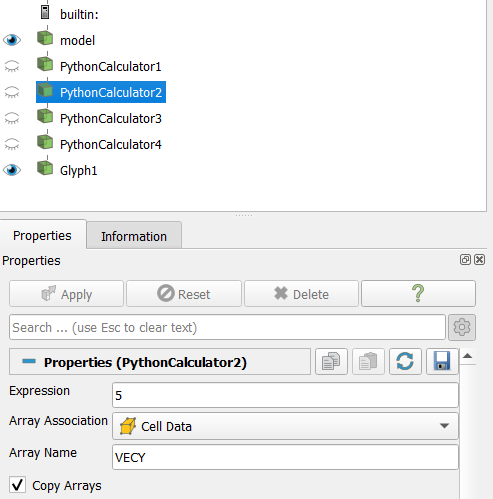
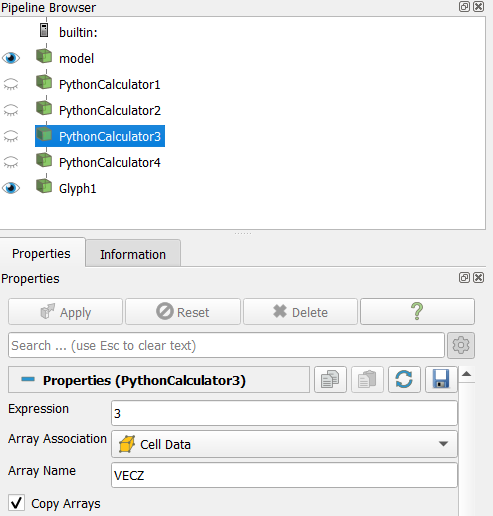
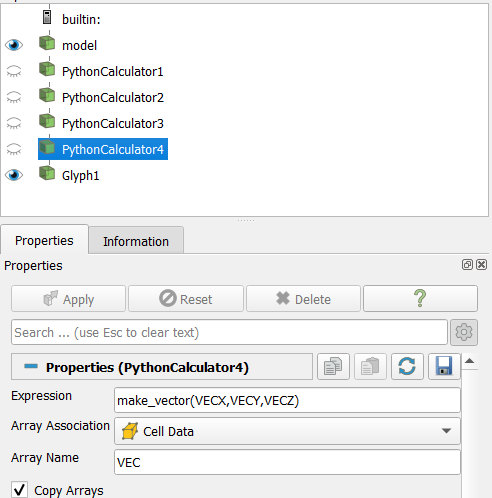
If I undestand your question correctly, you can use ‘Python calculator’ filter to create a new array of vectors with the proper length (according to each cell size) and proper direction (according to Flux data). Here is an example how to create a new array of vectors where dx depends on the cell volume, and dy and dz are constant values:
You can tune the formulas inside Python calculator’s (to add the dependencies from Flux vectors components, and correct the dependency from cell sizes).
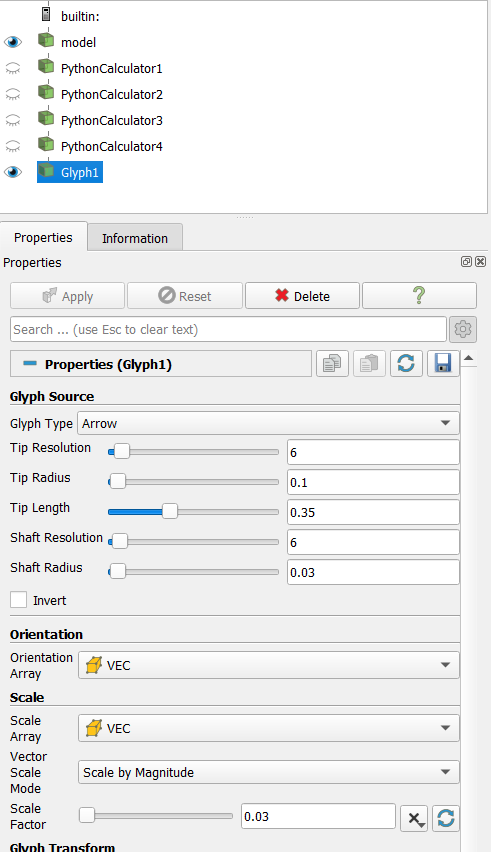
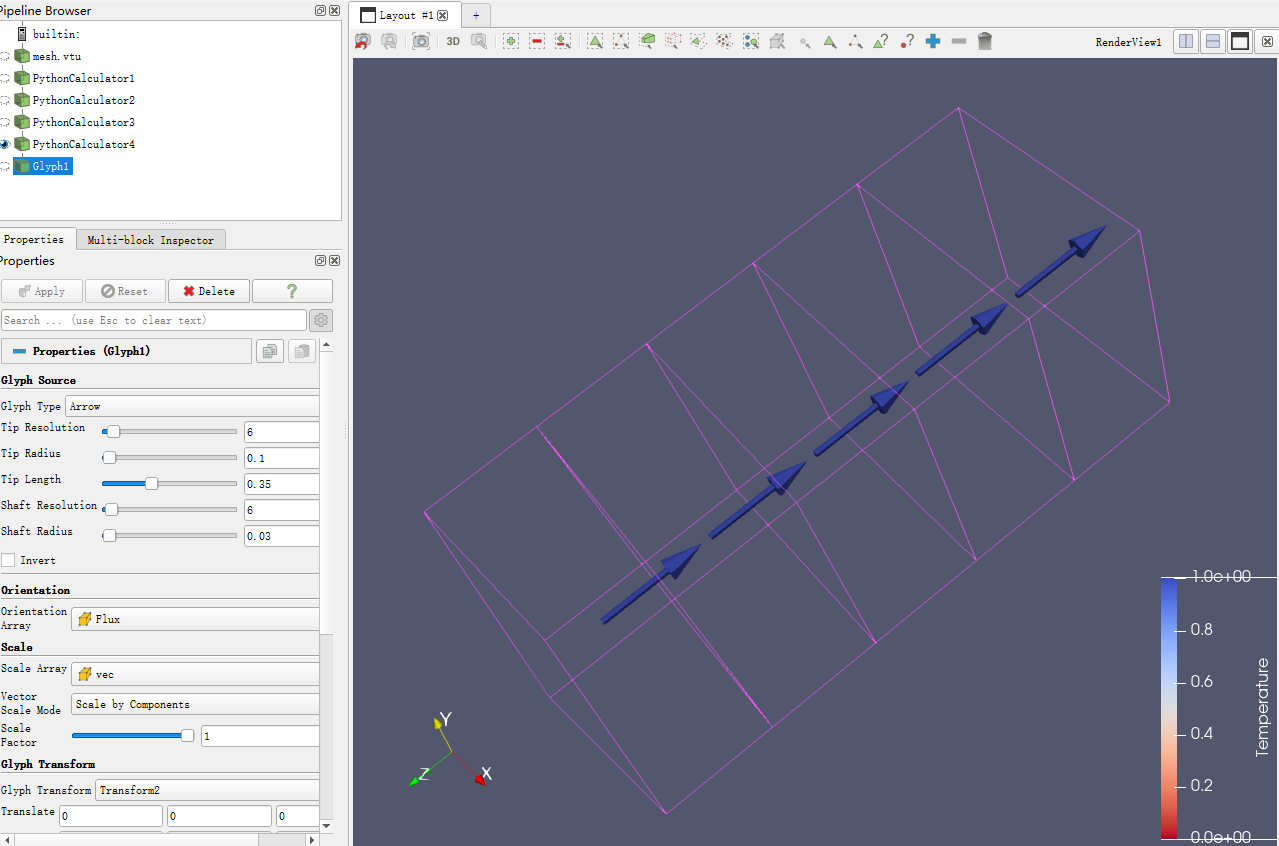
when the Orientation Array of Glyph1 is vec,the display effect of vector is consistent with our expectation.But in my project,the Orientation Array of Glyph1 should be flux,when change the Orientation Array to flux,The starting point of vector is wrong. It always starts from the center of gravity of the cell。We want it to go from one face of the cell to another
So, you have a set of points which could be the starting points for arrows. Do you want to add that pointset to model and try to create arrows representing the flux vectors based on them? You can try to do it by means of Python calculator or/and Python plugin.
Maybe another option: that pointset is possible to do based on coordinates of vertices of the cell faces (centers of gravity of the faces).