Hi everyone,
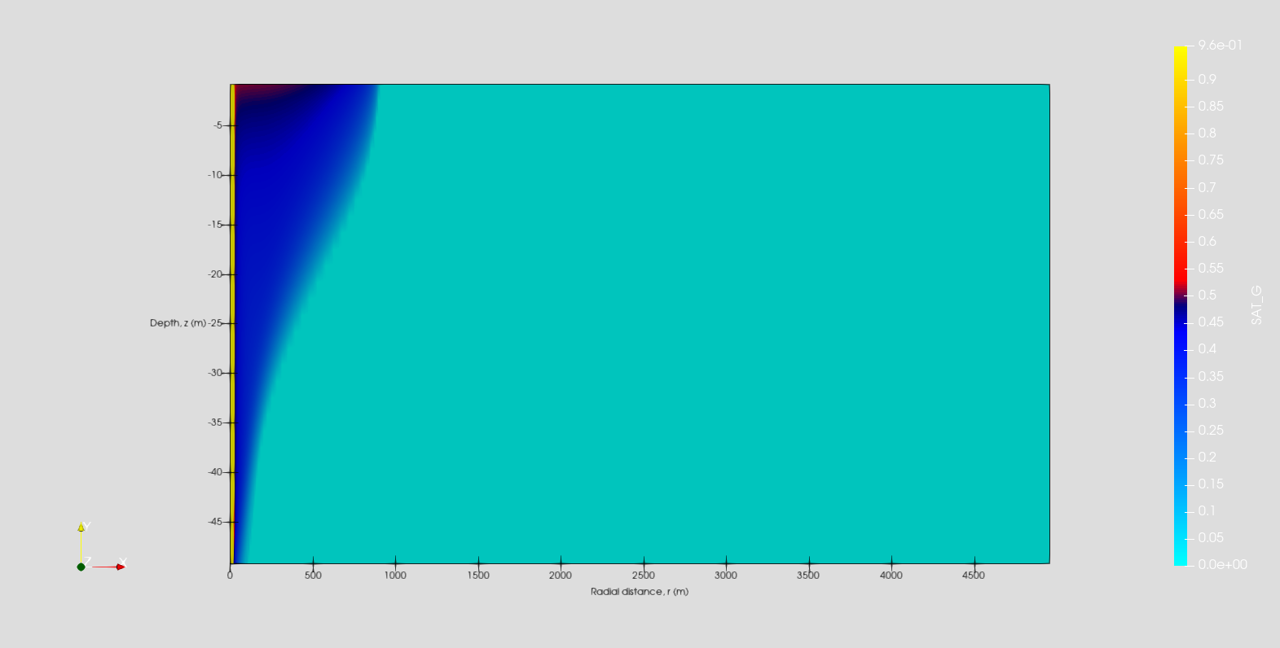
I am new user of Paraview. I have the following surface plot in which the x- and y-axis are in Cartesian scale. I would like to know how to change the scale of x-axis to logarithmic.
Not possible in the 3D view afaik.
The figure is 2D (surface) plot.
Yes, but you are still in the 3D view, not in a chart view (which support log).
@kmorel What do you think? Good idea?
Any good ideas will be helpful.
I can see the utility of a log scale, but it could be problematic in the 3D view as things get undefined <= 0.
An easy workaround is to use the Calculator filter to compute the log of the point coordinates.
Ken, I agree. Not a good feature to add to ParaView. Rafaat, as Ken mentions, try the calculator filter. Although i have not looked, I bet it is covered in the ParaView Guide.
I have used the calculator feature before to evaluate change in pressure, temperature, etc but I am not sure how to use it for the coordinates. Any guide for this step? I am sorry, I am new user of Paraview.
Please look in the ParaView guide, chapter 9.1. You can find the ParaView guide through the Help menu.
Thanks Cory. I should have added the link.