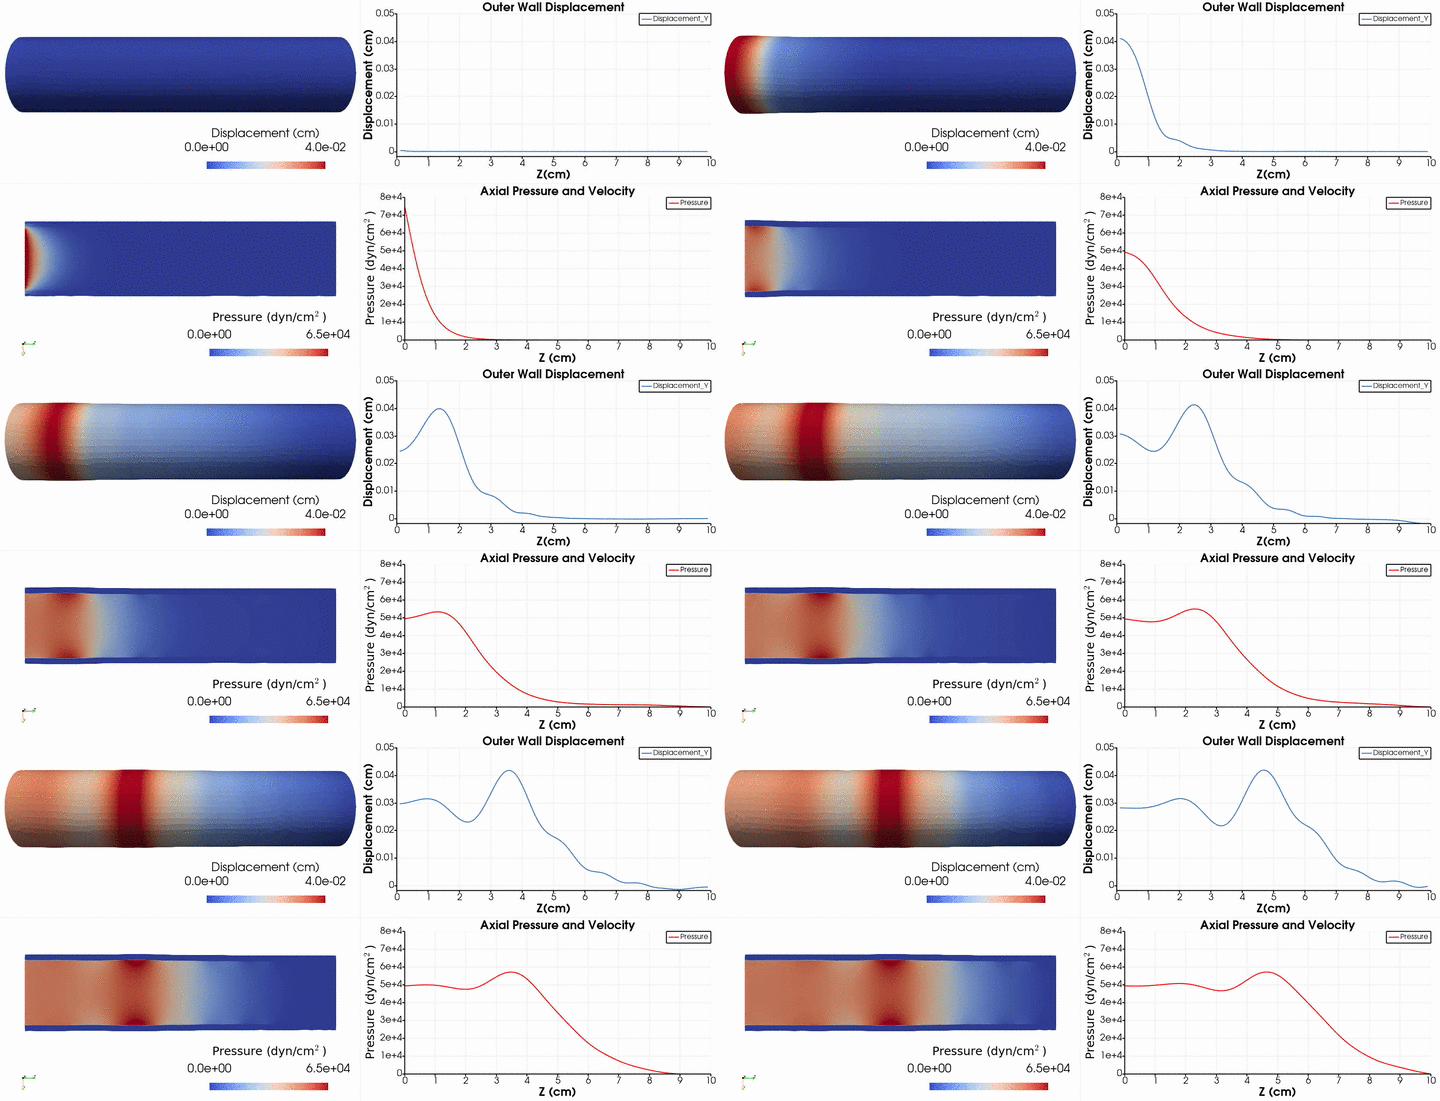
Hi everyone, I would like to create graphs like the ones I report here in the video clip.
I have 1000 .vtu files related to an FSI simulation that I would like to be able to plot continuously, how can I do it?
Thanks for all.

Hi everyone, I would like to create graphs like the ones I report here in the video clip.
I have 1000 .vtu files related to an FSI simulation that I would like to be able to plot continuously, how can I do it?
Thanks for all.

This looks like a simple application of the Plot Over Line filter.
Yes, I know that I have to use the Plot Over Line filter but my problem, as you can see from the video, is the non-continuity of the graph that goes intermittently.
I wondered if there is a special filter to have a continuous trend but considering what you told me i think it’s a problem related to my computer’s hardware.
Thanks a lot for your answer,
Angelo