Hi all,
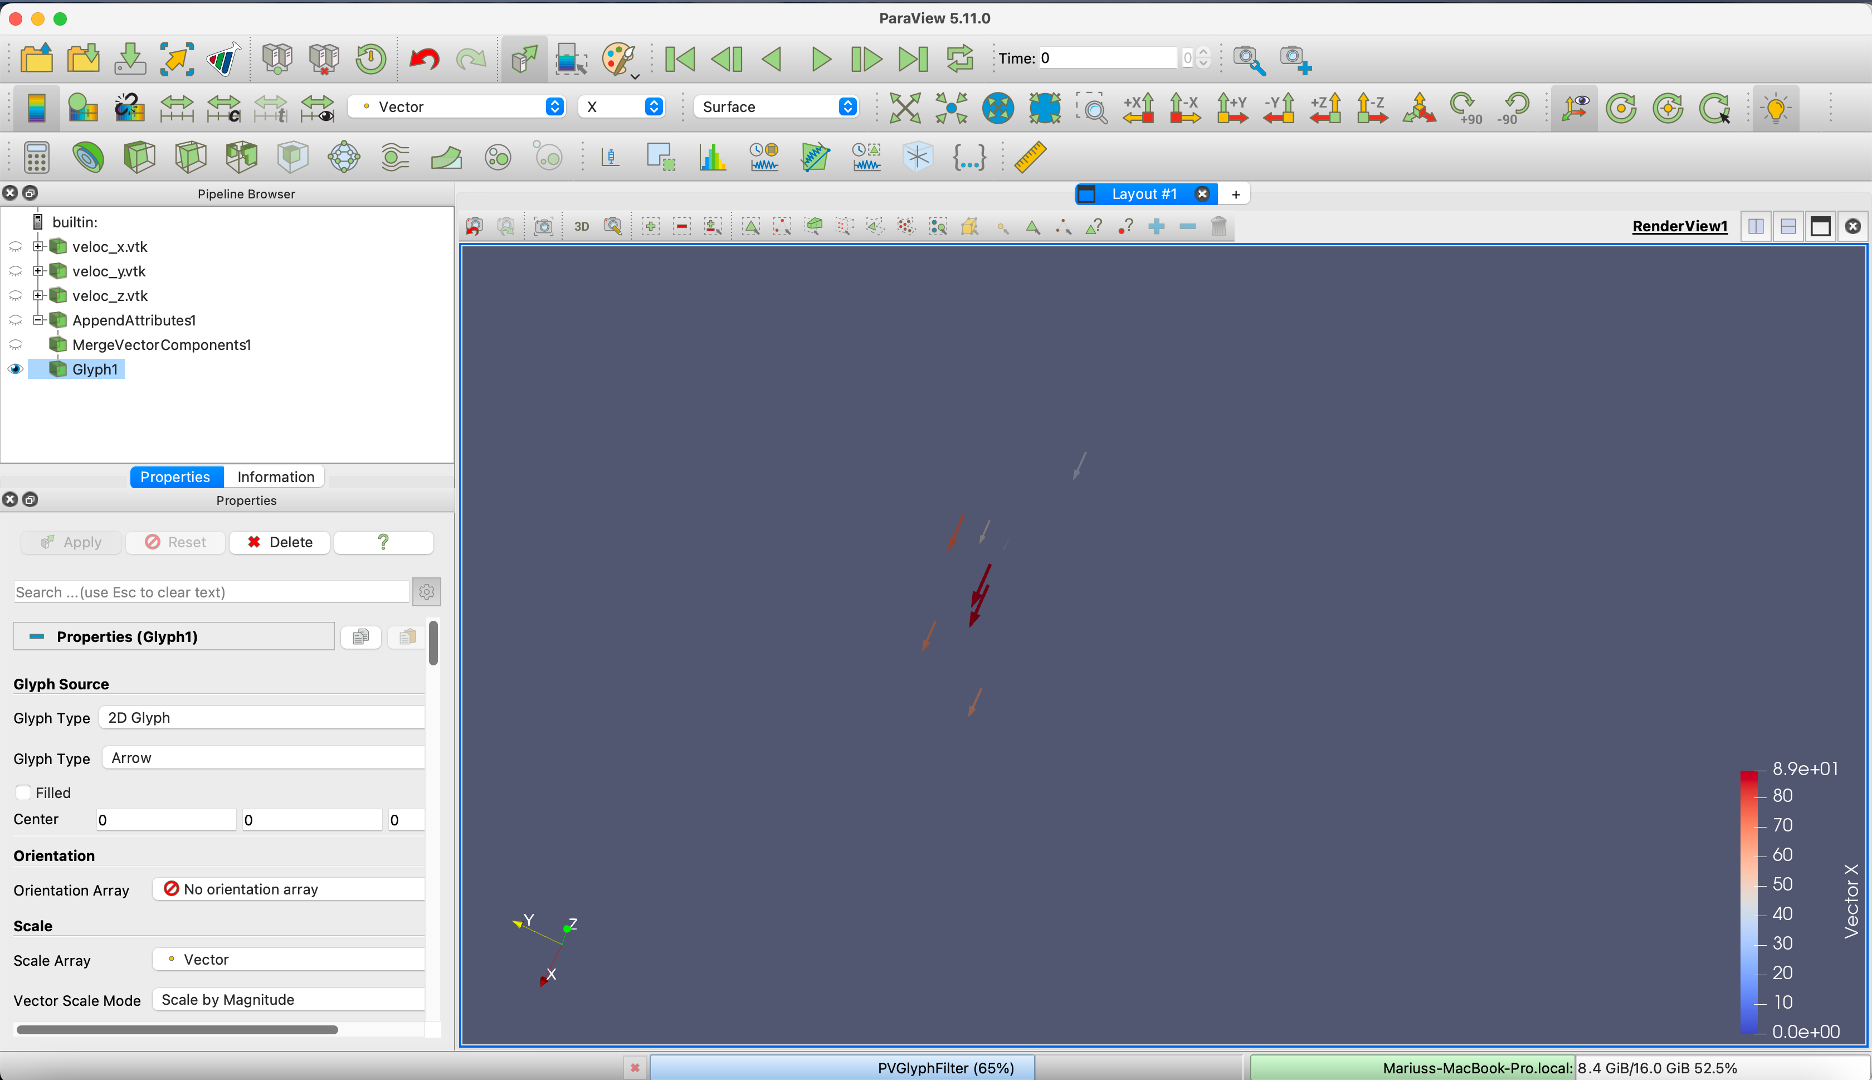
I am rather new to Paraview and have been reading a bit about vector plotting techniques to indicate flow direction and velocity magnitudes. I am quite stuck, however, with my 2 files.
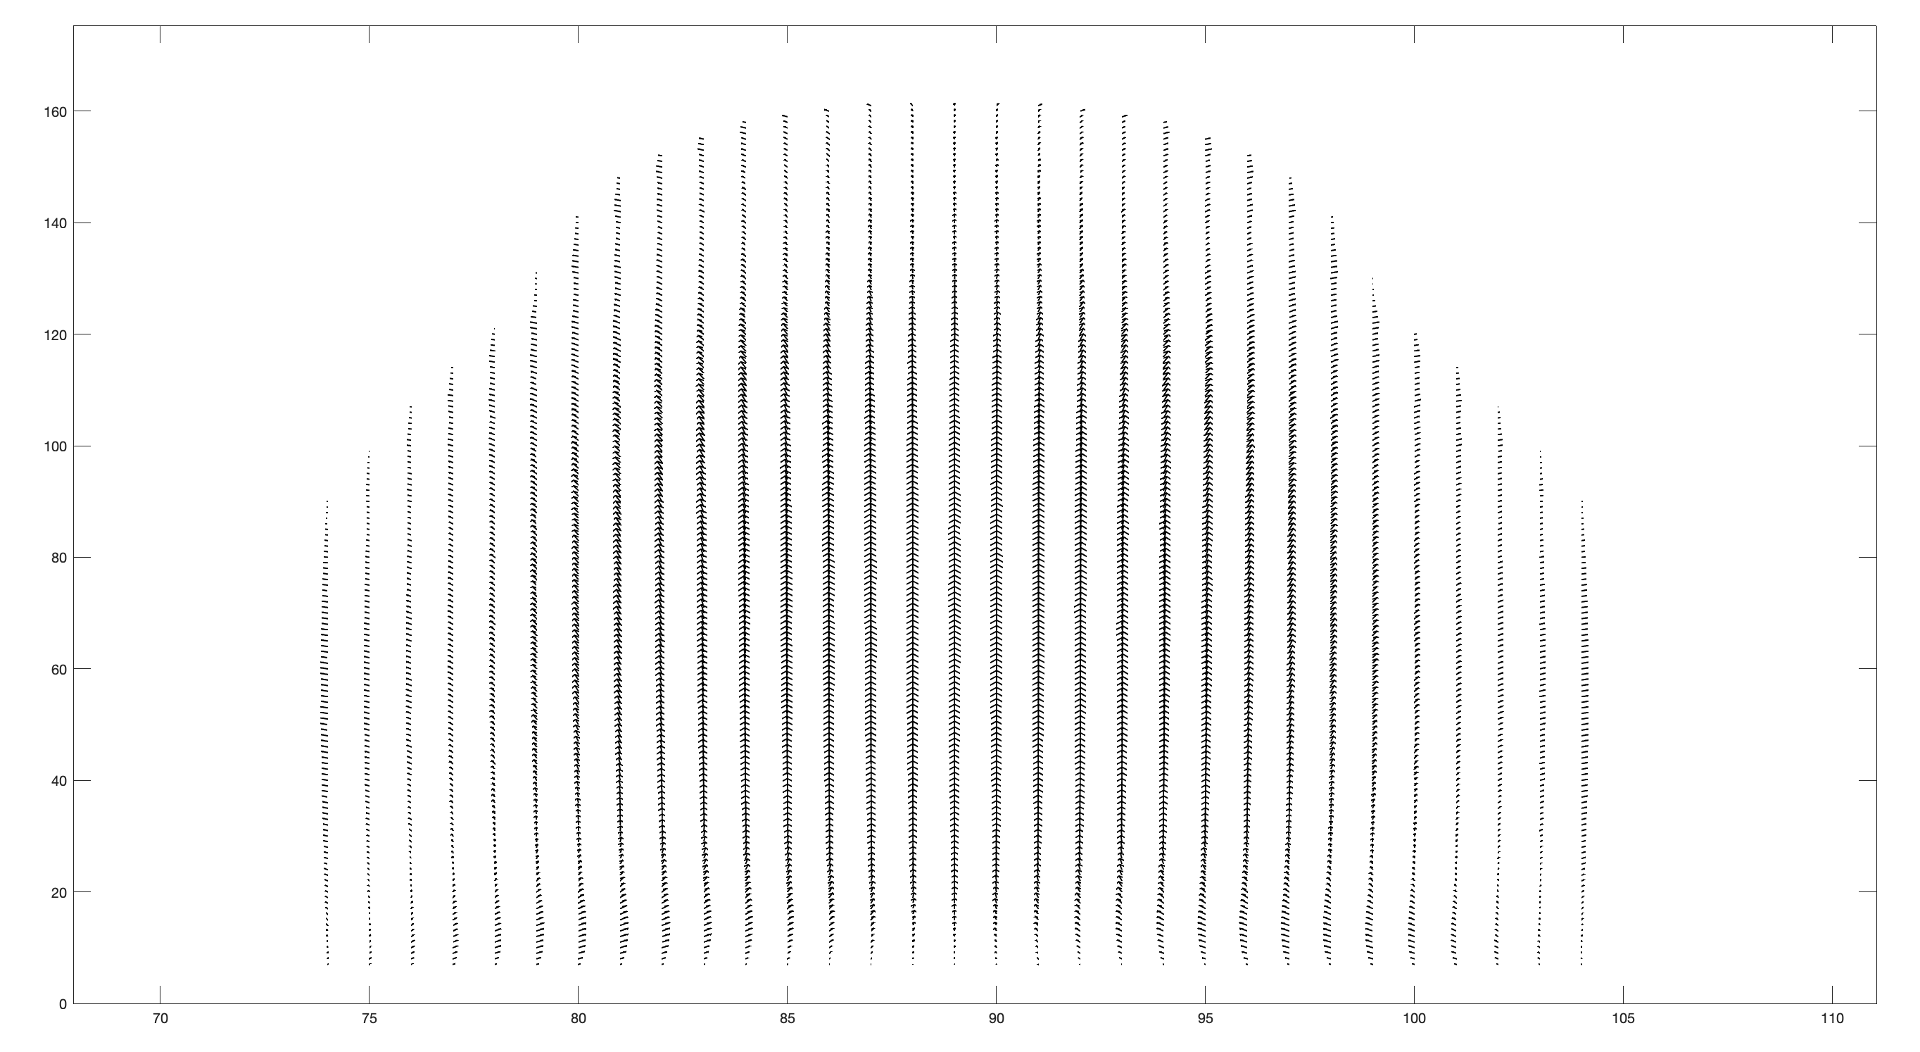
These are both .vtk files of the magnitude of the x and y components of a velocity field of a glacier. What I would like in the end is just a field of arrows which point in the direction of the flow and whose size correlates to the velocity magnitude. I have read about stream tracer but it stays greyed out for me. I wonder if anybody can help me or at least give me some guidance about how this can be done. Thanks!
x component: veloc_x.vtk - Google Drive
y component: veloc_y.vtk - Google Drive
(what I did to plot these:
- filter → threshold → lower threshold 0.1
- Representation: points with points size 25)