for example you type the equations for x,y,z and get the respective surface
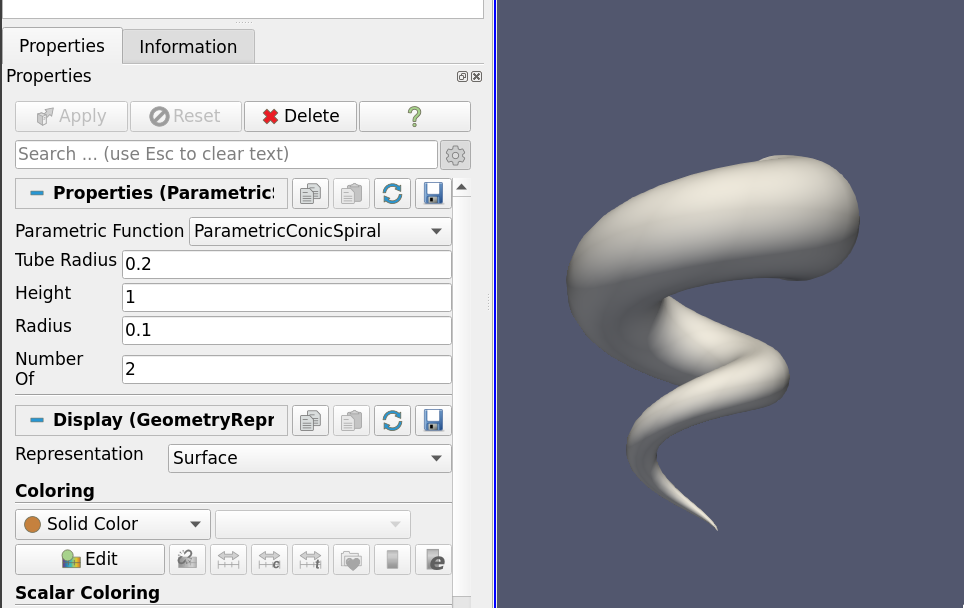
The closest that exist is an example plugin called ParametricSurfaces that lets you do something like that:
Here is the plugin:
ParametricSource.xml (1.6 KB)
The rest could be done with a programmable filter though, eg see this:
https://docs.paraview.org/en/latest/ReferenceManual/pythonProgrammableFilter.html#helix-source
I Tried the programmable to create a supershape. but the only thing i got it was lines (1st code).
Then I tried based on mathplotlib but I couldn’t got any results either
# Code for 'Script'

#This script generates a helix curve.
#This is intended as the script of a 'Programmable Source'
import math
import numpy as np
from vtk.numpy_interface import algorithms as algs
from vtk.numpy_interface import dataset_adapter as dsa

numPts = 80  # Points along Helix
length = 8.0 # Length of Helix
rounds = 3.0 # Number of times around
a=1
b=1
m=4
n1=12
n2=15
n3=15

def r(fi):
 return (((abs(np.cos(m*fi/4)/a))**(n2))+((abs(np.sin(m*fi/4)/b))**(n3)))**(-1/n1)

# Compute the point coordinates for the helix.

index = np.arange(-numPts/2, numPts/2, dtype=np.int32)
scalars = index * rounds * 2 * math.pi / numPts
scalars2 = index * rounds * math.pi / numPts

x = r(scalars)*np.cos(scalars)*r(scalars2)*np.cos(scalars2);
y = r(scalars)*np.sin(scalars)*r(scalars2)*np.cos(scalars2)
z = r(scalars2)*np.sin(scalars2)

# Create a (x,y,z) coordinates array and associate that with
# points to pass to the output dataset.
coordinates = algs.make_vector(x, y, z)
pts = vtk.vtkPoints()
pts.SetData(dsa.numpyTovtkDataArray(coordinates, 'Points'))
output.SetPoints(pts)

# Add scalars to the output point data.
output.PointData.append(index, 'Index')
output.PointData.append(scalars, 'Scalars')
output.PointData.append(scalars2, 'Scalars2')

# Next, we need to define the topology i.e.
# cell information. This helix will be a single
# polyline connecting all the  points in order.
ptIds = vtk.vtkIdList()
ptIds.SetNumberOfIds(numPts)
for i in range(numPts):
   #Add the points to the line. The first value indicates
   #the order of the point on the line. The second value
   #is a reference to a point in a vtkPoints object. Depends
   #on the order that Points were added to vtkPoints object.
   #Note that this will not be associated with actual points
   #until it is added to a vtkPolyData object which holds a
   #vtkPoints object.
   ptIds.SetId(i, i)

# Allocate the number of 'cells' that will be added. We are just
# adding one vtkPolyLine 'cell' to the vtkPolyData object.
output.Allocate(1, 1)

# Add the poly line 'cell' to the vtkPolyData object.
output.InsertNextCell(vtk.VTK_POLY_LINE, ptIds)
# Code for 'Script'

#This script generates a helix curve.
#This is intended as the script of a 'Programmable Source'
import math
import numpy as np
from vtk.numpy_interface import algorithms as algs
from vtk.numpy_interface import dataset_adapter as dsa

numPts = 32  # Points along Helix
length = 8.0 # Length of Helix
rounds = 3.0 # Number of times around
a=1
b=1
m=4
n1=12
n2=15
n3=15

def r(fi):
 return (((abs(np.cos(m*fi/4)/a))**(n2))+((abs(np.sin(m*fi/4)/b))**(n3)))**(-1/n1)

# Compute the point coordinates for the helix.

#index = np.arange(-numPts/2, numPts/2, dtype=np.int32)
angle = np.linspace(-np.pi, np.pi, numPts)
angle2 = np.linspace(-np.pi/2, np.pi/2, numPts)
scalars, scalars2 = np.meshgrid(angle, angle2)

x = r(scalars)*np.cos(scalars)*r(scalars2)*np.cos(scalars2);
y = r(scalars)*np.sin(scalars)*r(scalars2)*np.cos(scalars2)
z = r(scalars2)*np.sin(scalars2)
print(x[1])
# Create a (x,y,z) coordinates array and associate that with
# points to pass to the output dataset.
coordinates = algs.make_vector(x, y, z)
pts = vtk.vtkPoints()
pts.SetData(dsa.numpyTovtkDataArray(coordinates, 'Points'))
output.SetPoints(pts)

# Add scalars to the output point data.
output.PointData.append(angle, 'Angle')
output.PointData.append(angle2, 'Angle2')
output.PointData.append(scalars, 'Scalars')
output.PointData.append(scalars2, 'Scalars2')

# Next, we need to define the topology i.e.
# cell information. This helix will be a single
# polyline connecting all the  points in order.
ptIds = vtk.vtkIdList()
ptIds.SetNumberOfIds(numPts)
for i in range(numPts):
   #Add the points to the line. The first value indicates
   #the order of the point on the line. The second value
   #is a reference to a point in a vtkPoints object. Depends
   #on the order that Points were added to vtkPoints object.
   #Note that this will not be associated with actual points
   #until it is added to a vtkPolyData object which holds a
   #vtkPoints object.
   ptIds.SetId(i, i)

# Allocate the number of 'cells' that will be added. We are just
# adding one vtkPolyLine 'cell' to the vtkPolyData object.
output.Allocate(1, 1)

# Add the poly line 'cell' to the vtkPolyData object.
output.InsertNextCell(vtk.VTK_POLY_LINE, ptIds)
You are adding lines, so you get lines I suppose.
ok how can i get a surface?
VTK_QUAD ?
You’ll need to learn about VTK I’m afraid: https://kitware.github.io/vtk-examples/site/Python/GeometricObjects/Quad/
Ok it drew a shape but for the shape i want i need before the definition of x,y,z I need to add a comand like meshgrid.
Output mensage:
Traceback (most recent call last):
  File "<string>", line 20, in <module>
  File "<string>", line 43, in RequestData
  File "C:\Program Files\ParaView 5.9.1-Windows-Python3.8-msvc2017-64bit\bin\Lib\site-packages\vtkmodules\numpy_interface\algorithms.py", line 861, in make_vector
    return algs.make_vector(arrayx, arrayy, arrayz)
  File "C:\Program Files\ParaView 5.9.1-Windows-Python3.8-msvc2017-64bit\bin\Lib\site-packages\vtkmodules\numpy_interface\internal_algorithms.py", line 559, in make_vector
    raise ValueError("Can only merge 1D arrays")
ValueError: Can only merge 1D arrays
When I put VTK_QUAD it drew a shape that should be closed. There is any way to use a np.meshgrid?
I found this code but it didnt drew any thing.
import vtk
import numpy as np
from vtk.numpy_interface import dataset_adapter as dsa
iD=vtk.vtkImageData()
dims=[31,31,31]
iD.SetSpacing(1,1,1)
iD.SetOrigin(0,0,0)
iD.SetDimensions(dims)
xaxis = np.linspace(-0.5,1,dims[0])
yaxis = np.linspace(-1,1,dims[1])
zaxis = np.linspace(-1,0.5,dims[2])
[xc,yc,zc] = np.meshgrid(xaxis,yaxis,zaxis)
data = np.sqrt(xc**2+yc**2+zc**2)
image=dsa.WrapDataObject(iD)
image.PointData.append(data.ravel(),"scalar")