Plassf
April 1, 2020, 10:16am
1
Hello,
I have run two simulations with different mesh sizes from the “aachenbomb” tutorial on OpenFoam, and I would like to plot on the same graph, the curves of evolution of the liquid penetration distance versus time of these two simulations, how can I please proceed?
mwestphal
April 1, 2020, 10:31am
2
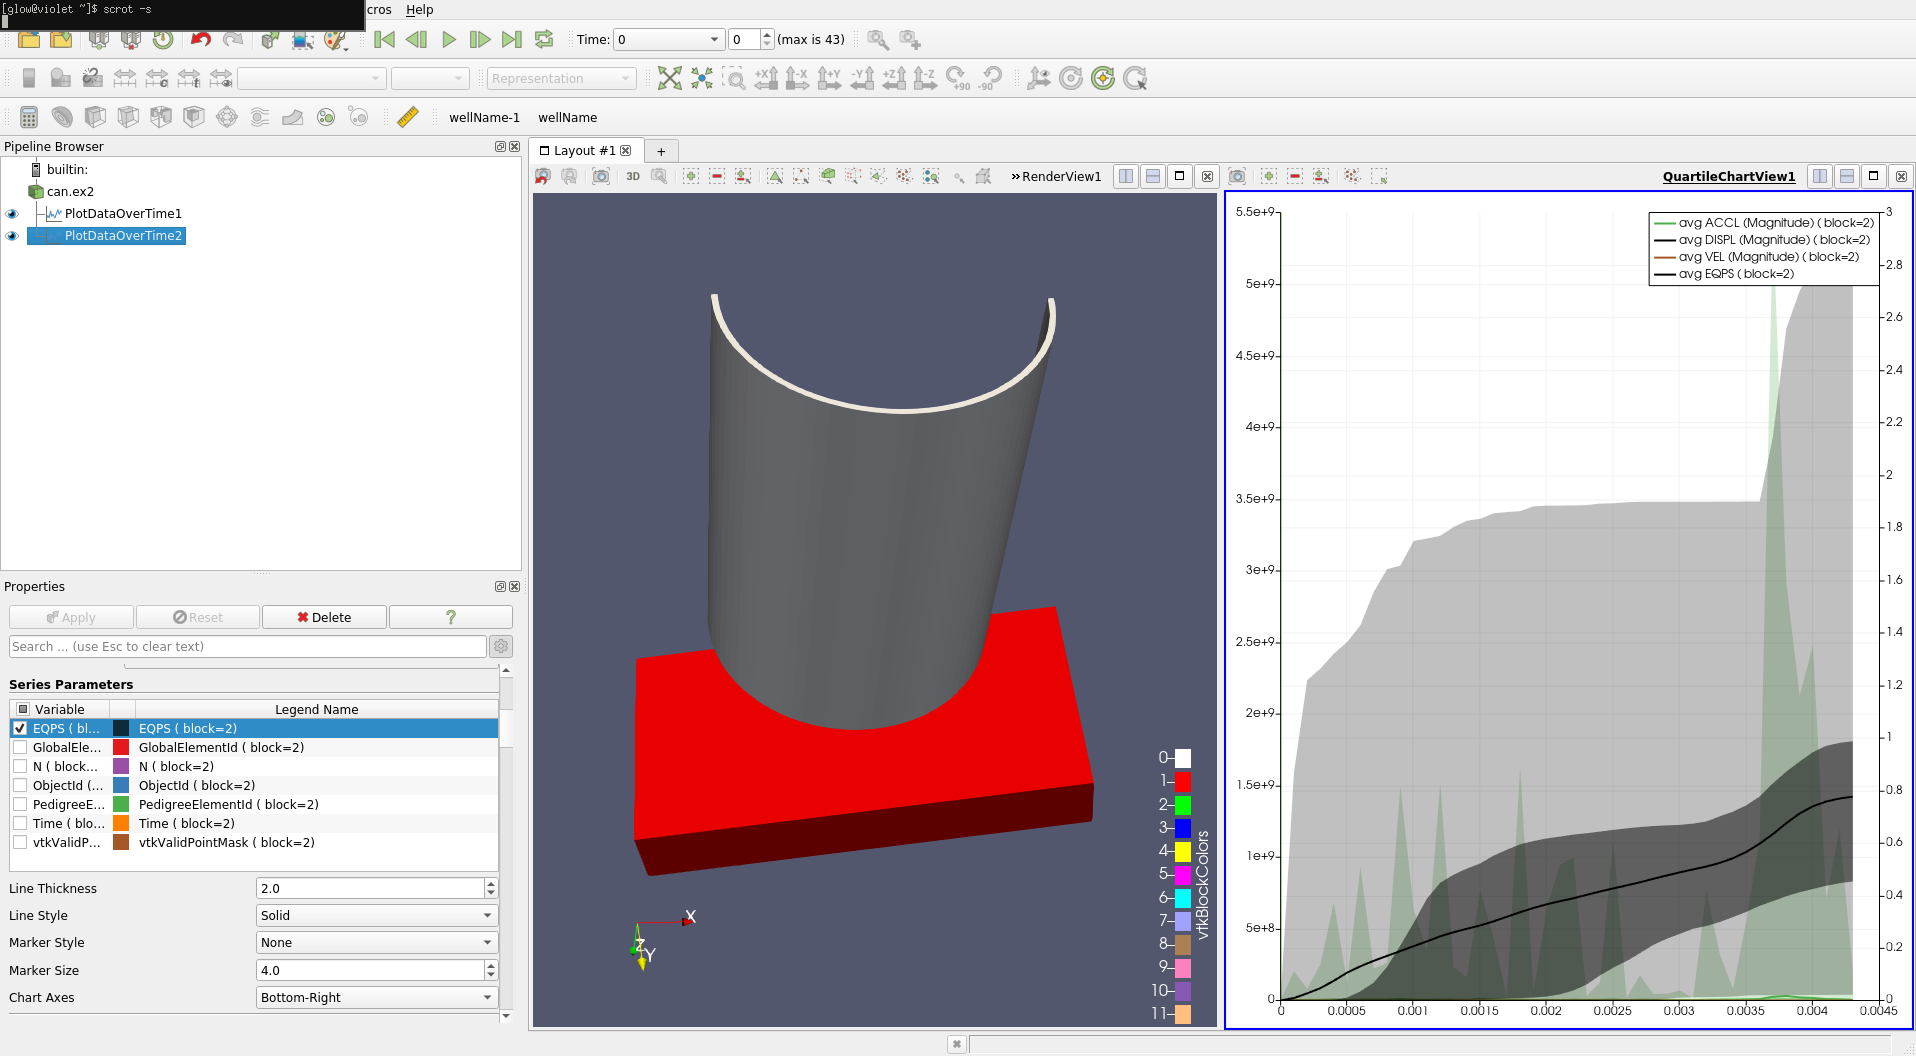
Plot Data over time should do the trick.
Plassf
April 1, 2020, 11:58am
3
Thanks for your response.
In fact I can’t load the results of the two simulations on the plot data over time panel, only those of one simulation are available.
mwestphal
April 2, 2020, 3:07am
4
I can do it without any issue here.
Plassf
April 2, 2020, 8:09am
5
thank you but It’s not what I need, I would like to plot on the same graph to curves of two different simulations.
mwestphal
April 7, 2020, 3:44am
6
I’m using two different sources, which is the same as two different “simulations”.
Please share what your are doing step by step, or a video, so we can help.