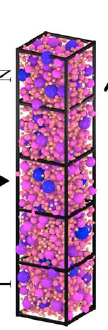
Hi. I want to enclose my figure inside a cubiodal boundary as shown in Fig 1 (figure attached). How can I do that in paraview?
I have also attached the vtk file for data on my figure.
pfc_data.vtk (492.7 KB)
Hi. I want to enclose my figure inside a cubiodal boundary as shown in Fig 1 (figure attached). How can I do that in paraview?
I have also attached the vtk file for data on my figure.
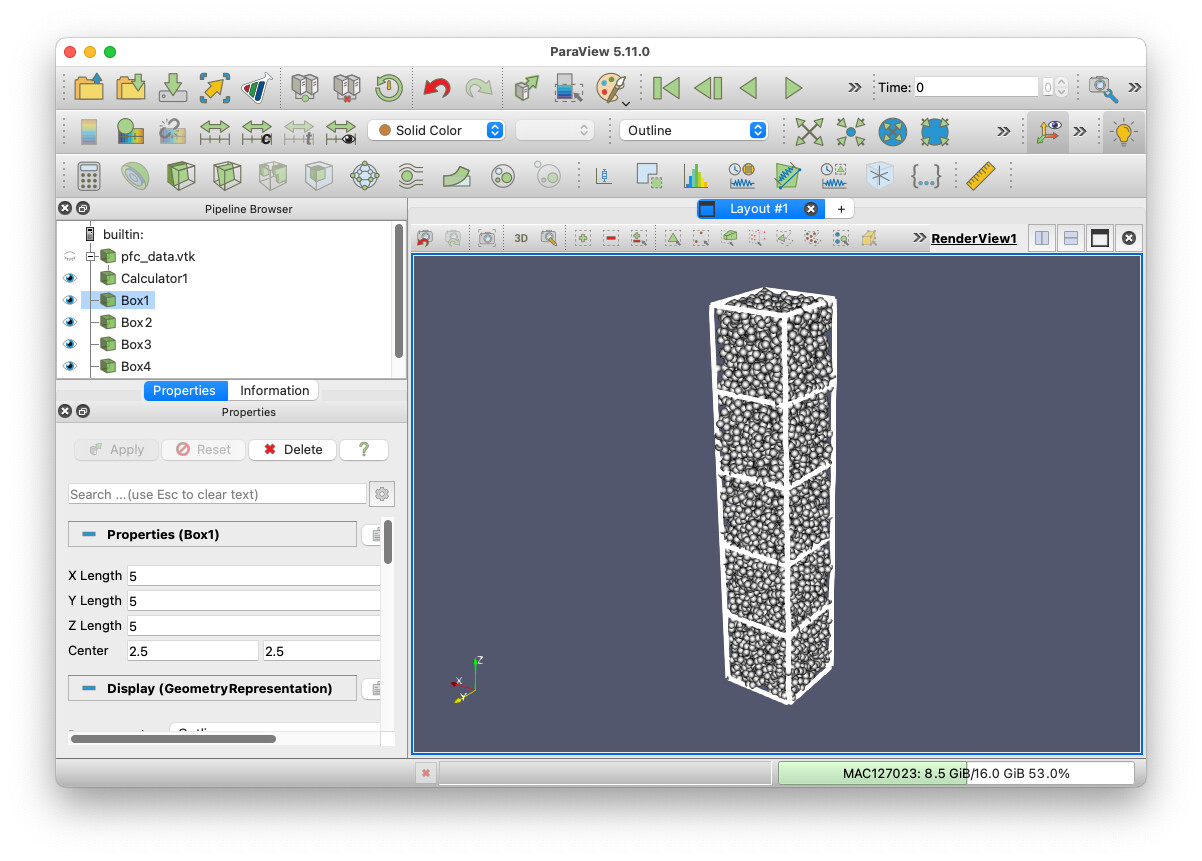
I am confused by this question. If you want a box around your geometry, you can use the Outline filter. I see from your screenshot that you must have already tried that, so you must be asking something else.
The other image you posted shows 5 boxes stacked over the spheres. There is no automatic way to do that, but you can create that by creating Box sources. You can use the parameters of the Box source to place it where you want (or you can use the Transform filter to move it). By default, the Box will show as a solid box, but change the representation (middle toolbar, about in the middle) from Surface to Outline. You can also adjust the line width.
Here is a screenshot of what I did along with a state file for what I did.
Hi. thank you for your reply. I have two more questions on the same problem
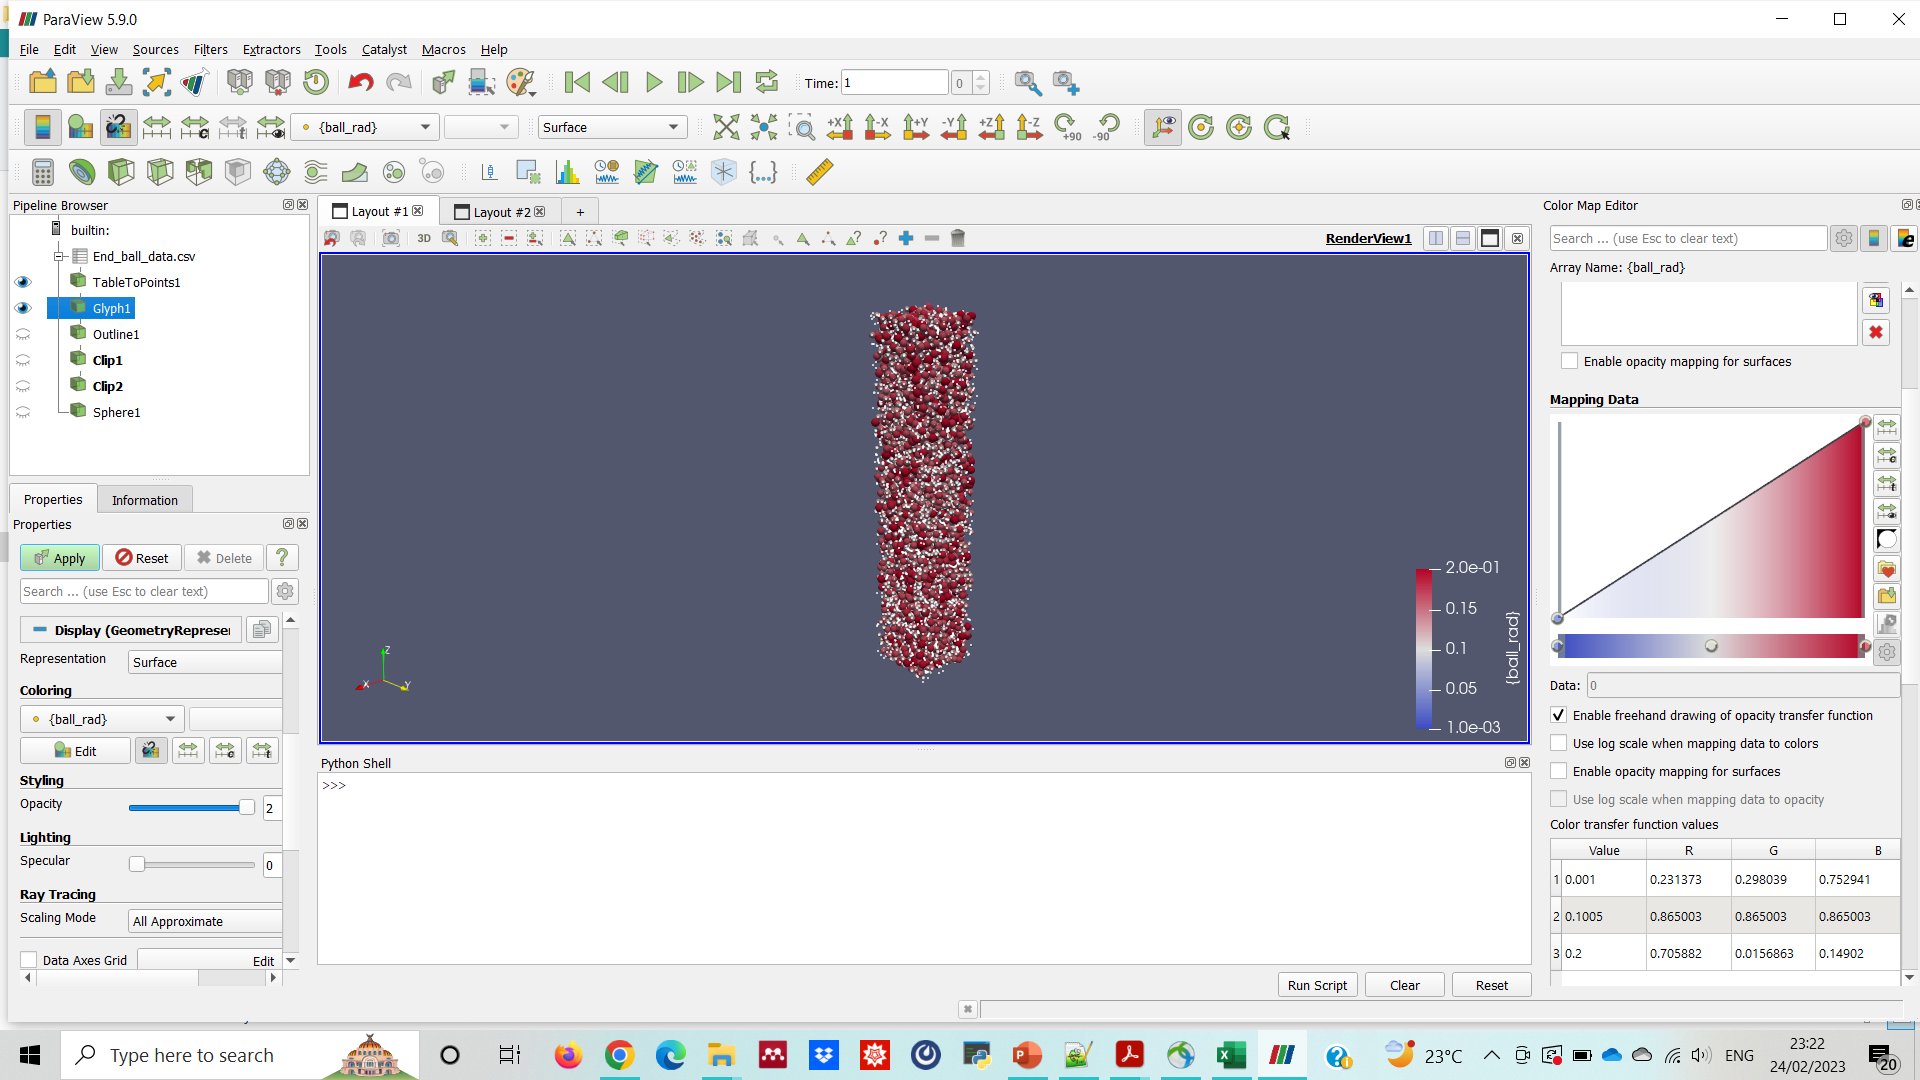
I tried to change the colormap using the following code in python shell (as given in Paraview documentation 3.3) but it didn’t work:
colorMap = GetColorTransferFunction(‘ball_rad’)
colorMap.RGBPoints = [1.0, 0.705, 0.015, 0.149,
5.0, 0.865, 0.865, 0.865,
10.0, 0.627, 0.749, 1.0,
19.9495, 0.231373, 0.298039, 0.752941]
Note: in the following code RGB values are just for reference. In actual I want the RGB values from the excel file
rgb values.xlsx (18.3 KB)
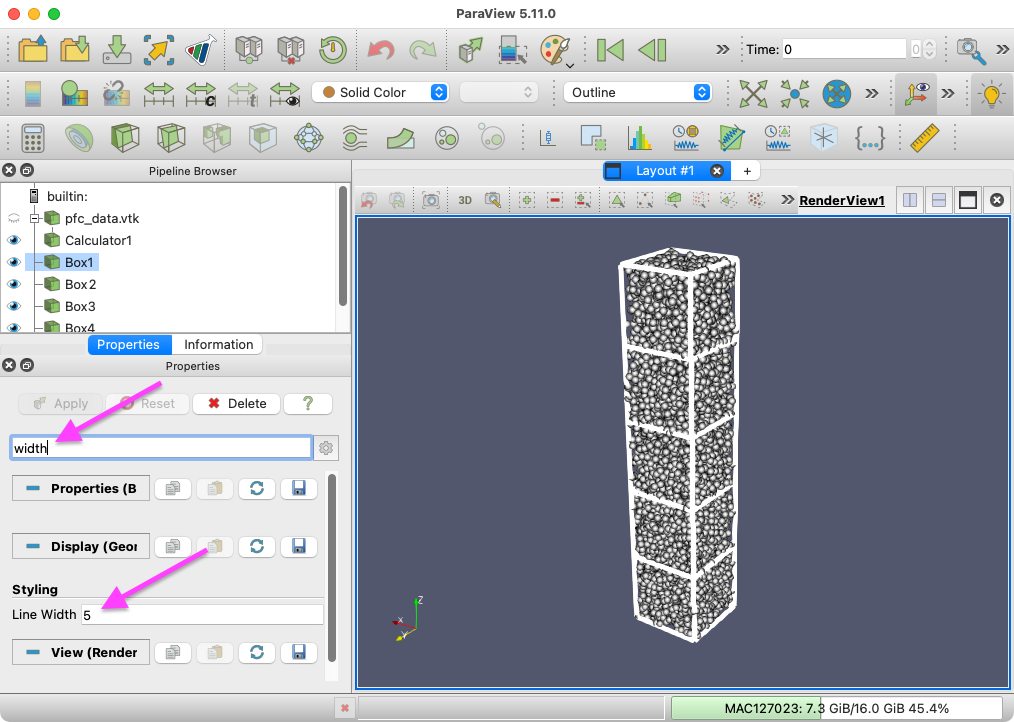
There is a display property named Line Width in the display properties that can be used to adjust the line width. It is an “advanced” property somewhat hard to find, so I usually just type width in the search box at the top of the properties panel to find it.
The colors are controlled through the color map editor. Information about editing color maps can be found in the ParaView user’s guide and numerous other sources.
You can import and export color maps from the presets dialog box ![]() . The configuration for a preset is in json format, so you cannot just load in your excel file, but it is pretty easy to convert. The format looks like this:
. The configuration for a preset is in json format, so you cannot just load in your excel file, but it is pretty easy to convert. The format looks like this:
[
    {
        "ColorSpace" : "Lab",
        "Creator" : "mukul",
        "Name" : "mukul's custom colors for ball radius",
        "RGBPoints" :
        [
# Comma separated list of s, r, g, b points.
        ]
    }
]
Replace the comment with a comma-separated list of all the values in your excel file. You can do that by writing out the data as a csv file, adding a comma to the end of each line, and then copy-pasting it to this location in the json file. Here is a color preset containing the colors you provided: ball-radius-colors.json. Edit as you see appropriate.