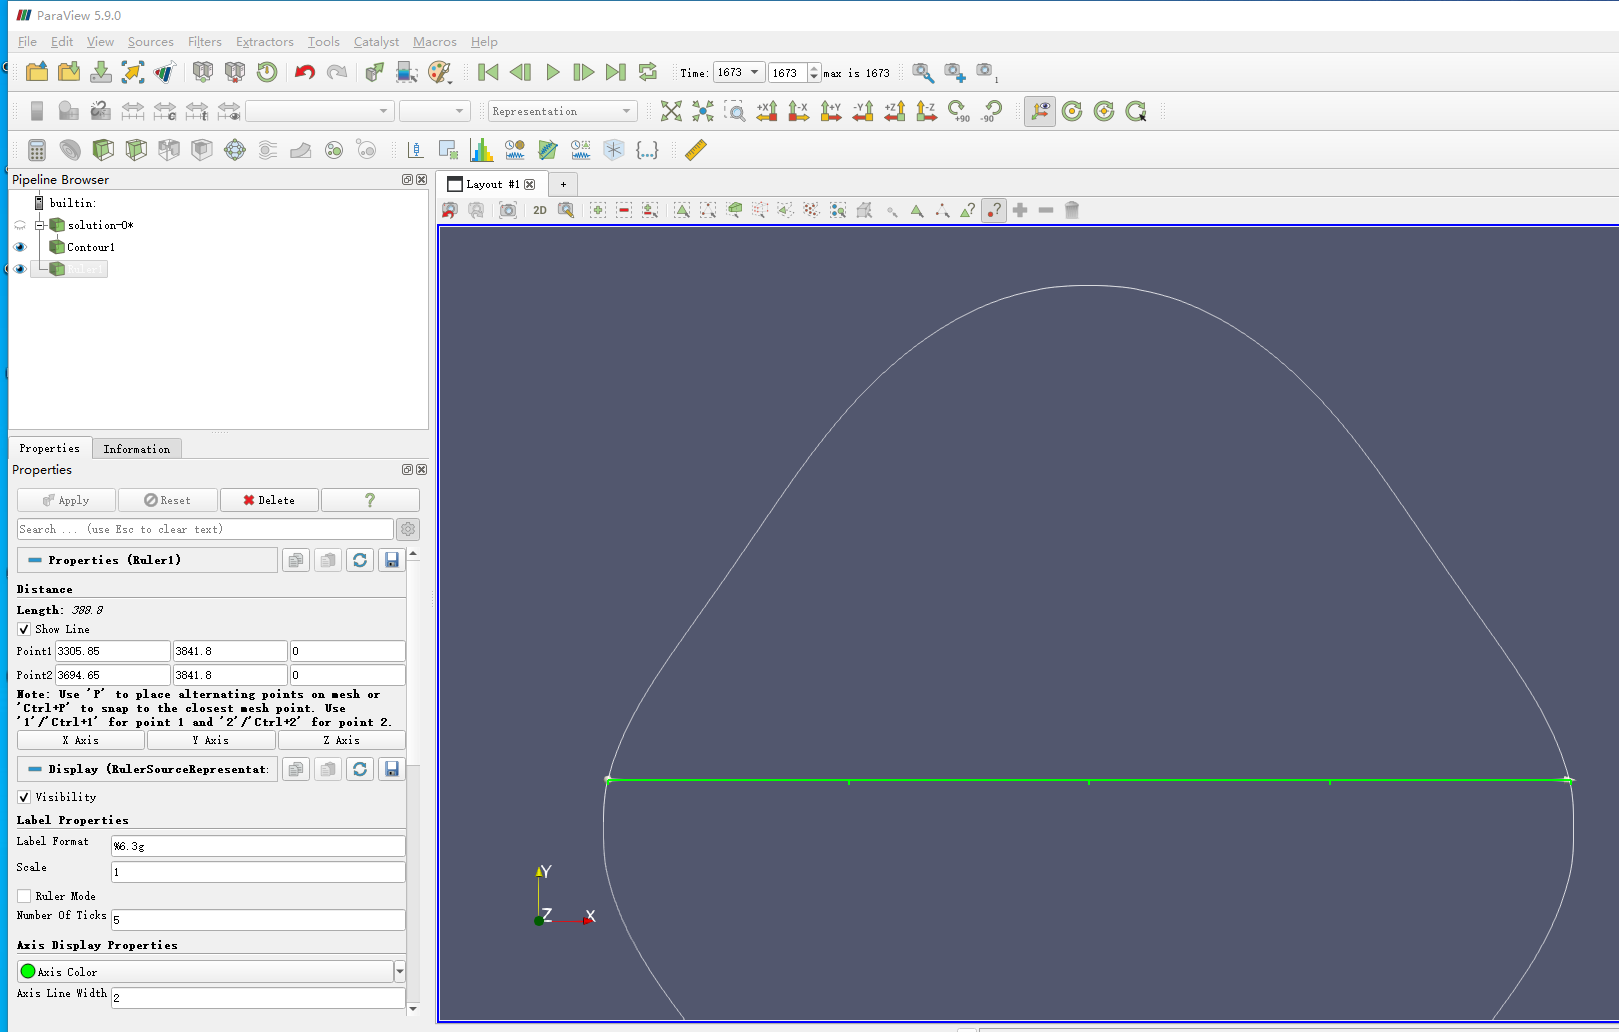
Hello everyone! I use Paraview to visualize my compution result. And I make a contour in my Paraview.This is my result.However, I want to fit curve which is above the green line as a quartic polynomial. I am confused about how to do that. I also want to know if I can extract the point coordinate on this curve so that I can fit this curve using python or matlab. thanks a lot!
I think you should do that in two steps:
- cut your data to keep only the part of interest, with the
Clipfilter. - use a
Programmable Filterto manipulate the actual data (so coordinates).
See programmable filter documentation: 5. Programmable Filter — ParaView Documentation 5.11.0 documentation
Thanks a lot! I have made it!