I am visualizing a particle based simulation (700000 particles, about 8GB for 120 timesteps, each step around 70MB) on a single machine (i5 CPU, 2,60 GHz, Intel Graphics Chip HD 530, 16GB of RAM) and I am using a 2D Glyphing Algorithm, depicitng a velocity field. As I want to see every frame of the simulation, I am using the “Snap to Timesteps” Mode. Unfortuanately the animation does not run fluently at all. By enabling caching Geometry I did not see much of a change. I checked the RAM usage while the animation was running. In both cases there is not more than 5GB being used (another 11 GB are free for usage). I made sure the whole animation will completely fit on the RAM, of course with the additional glyphing size. How can I make ParaView use all the RAM to ensure data processing is made only once and running fluent from the next run in the loop?
I have never used it, but try the Edit/ Settings/ General/ Advanced Icon/ Cache Geometry for Animation checkbox. Next, you can change the amount that gets cached. Please let us know if this works!
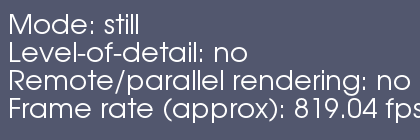
I totally oversaw the box for the amount that can get cached, now it works, thanks! Do you know if there is a way to measure the framerate of the animation?
Thanks alot for the answer. Caching geometries and displaying the status works fine on my normal client application. Is it true that the fps are only measuring the rendering speed and not the data processing speed? On my dataset it says 2.5-3.0 fps, but the actual framerate is way slower (I have 20 timesteps and measured 117 seconds which is around 6s average Update time and average 0.17fps). The fps shown does not change when caching geometries. But now the fps makes sense as the time for running through the dataset is around 7-8 seconds. Is there a way to measure the data processing time too? And is it possible to automatically write the data to file?
Furthermore (and more importantly), when I run all the settings in client-server-mode (for VR interaction with VRPN), they seem to be ignored. Neither the status information is shown on any of the screens (client or server process), nor the geometries are being cached (constant RAM usage and the animation is not getting any faster). Do you know what might be the problem here?
I am using the same program for both tests (ParaView 5.4.1). Did anyone have a similar experience and knows how to solve the problem?
For measuring the rendering and data processing speeds, see Tools->Timer Log. This spits out the time taken by individual components (that surpass a settable threshold) across the entire pipeline and on each process. You can save those out from the dialog.
See also the paraview.benchmark module in python. It is a more powerful interface to the same timing infrastructure. It has a couple of canned benchmark runs but it also helps you to save, load, and analyse the timerlog’s output.
Do you mean the Show Annotations option is ignored in this setup?
nor the geometries are being cached (constant RAM usage and the animation is not getting any faster). Do you know what might be the problem here?
Animation geometries are cached on the data server side and sent to whichever resource needs them (such as the client) each time the animation time is changed. If you are measuring RAM on the client side, then you won’t see a change in RAM usage. If your network transfer speed is slower than the animation geometry extraction, then you unfortunately won’t notice a speedup when caching is happening.