I can read a 2D text file with your kind answers for many questions. But, I do not know the next step, how to visualize the matrix in the Paraview. My data has this structure, 81 x 4096 matrix.
I followed this step:
opened the text file with Delimited text (CSV Reader).
changed the properties: deactivate the have headers.
changed the properties: " " in the Field Delimiter Characters.
changed the properties: activate the Merge Consecutive Delimiters
click “Apply”
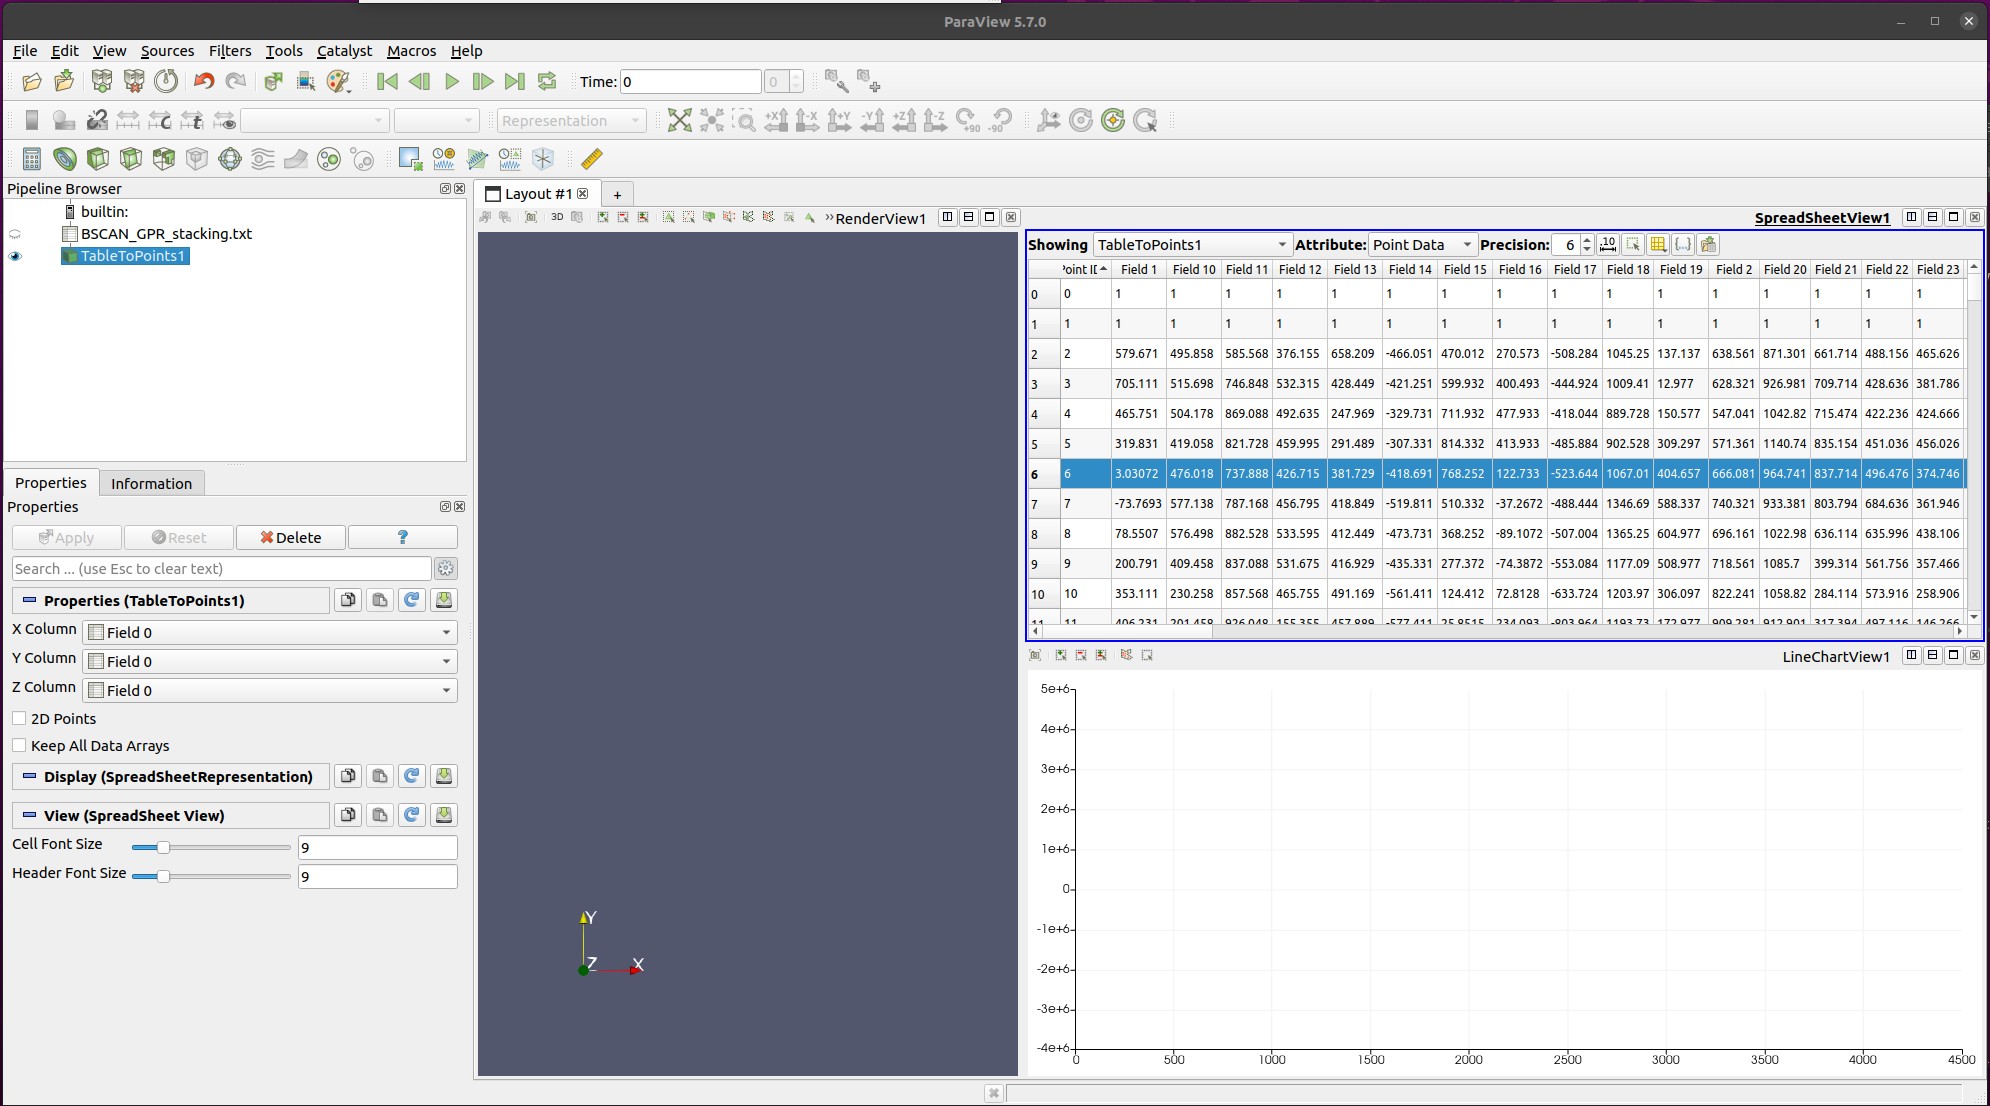
click the filter, Table to Points, in the Filters tap.
After this list of steps, I do not know how to image the matrix.
When I click the X column or Y or Z, this show many fields. This data is only 2D data. Then I need two axes.
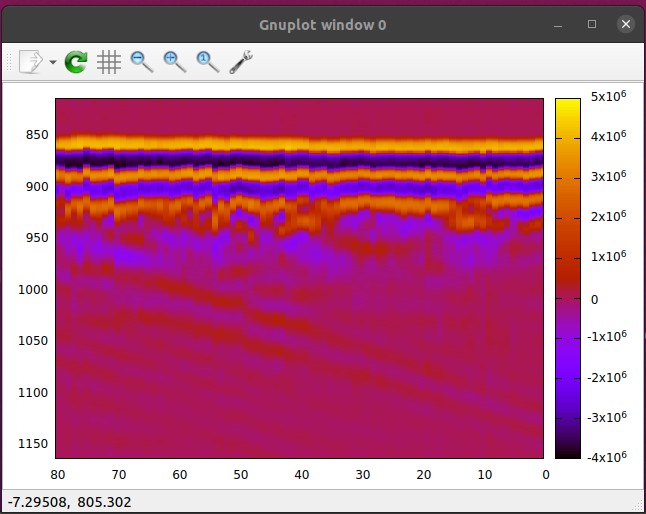
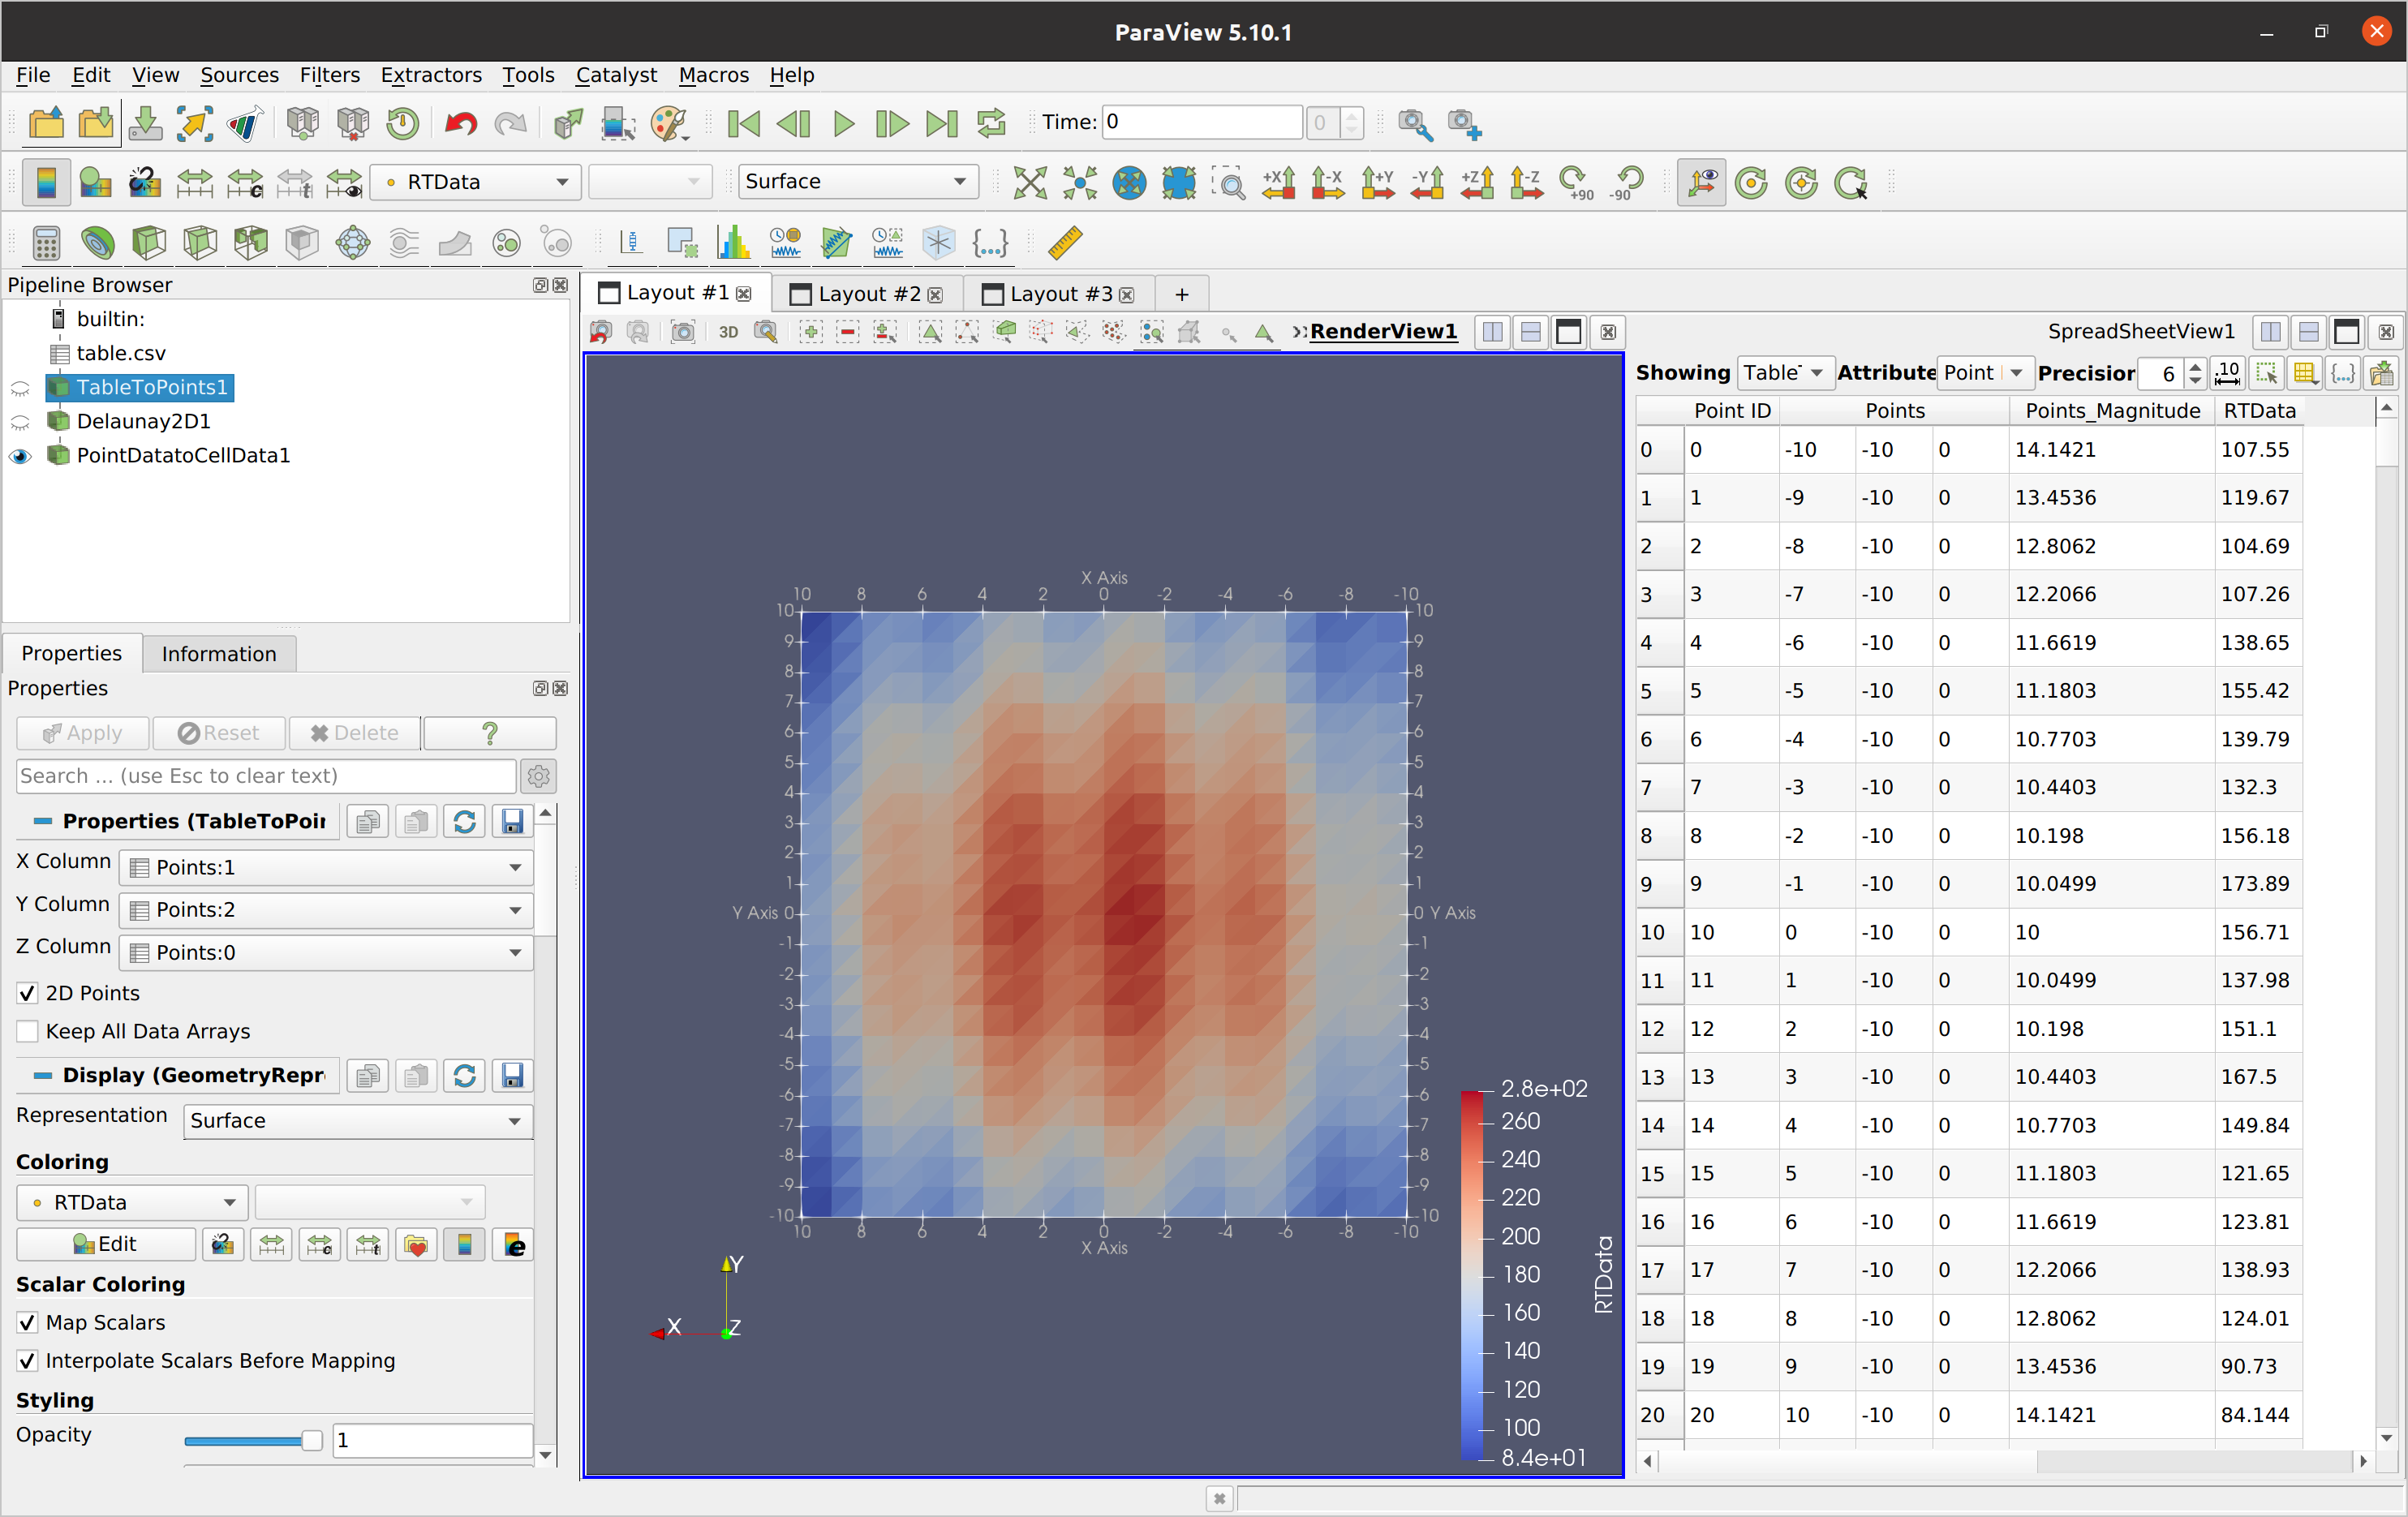
Check the Filter properties. X Column, Y Column should be mapped to the appropriate column of your table. Currently both of them point to Field 0. Check also the 2D Points checkbox. You can then use Delaunay2D and PointDatatoCellData to create an image similar to the one from gnuplot. See below