Hello!
I want to use the “PlotDataOverTime” filter but it works very slowly for a lot of steps. How can I increase the performance of this filter? I had an idea to request data not for each step but in blocks for each N steps( 1000 steps for example). I am studying vtkDemandDrivenPipeline, vtkExtractDataArraysOverTime and vtkPExtractSelectedArraysOverTime but cannot find a solution. Any ideas how I can do this? Or any ideas how to improve the performance of the “PlotDataOverTime” filter for a very large number of steps?
Thanks.
As the warning says, PlotDataOverTime actually requires to read all the time steps to be able to compute, so there is no way to speed it up. It is not the filter that takes time but the actual reading of the data from disk.
That being said, you can avoid reading the data multiples times if you want to use the PlotDataOverTime multiple times. Just add a “Temporal Cache” filter after your reader.
Thanks for reply, Mathieu.
I’m trying to use the “Temporal Cache” filter now. I checked on my smallest data (8 points, 2500 steps) although I would need to process more than thousands of points and millions of steps. First, I applied the PlotDataOverTime filter directly to my reader. The filter worked in 5 minutes. Next, I removed the filter, applied the “Temporal Cache” filter to the reader, and applied the PlotDataOverTime filter to the “Temporal Cache” filter. Processing has been going on for more than an hour and has not yet been completed.
Very strange, could you share your data ?
Unfortunately, I can’t share the data now because I’m working on an internal closed format and reader. But here is what I noticed. What is described above is typical for a Python reader. I rewrote the reader in C++ and did a check on the same data and got the following results:
- application directly to the reader in about 3 minutes
- first application to Temporal Cache in about 5 minutes
- repeated application to “Temporal Cache” in about 20 seconds
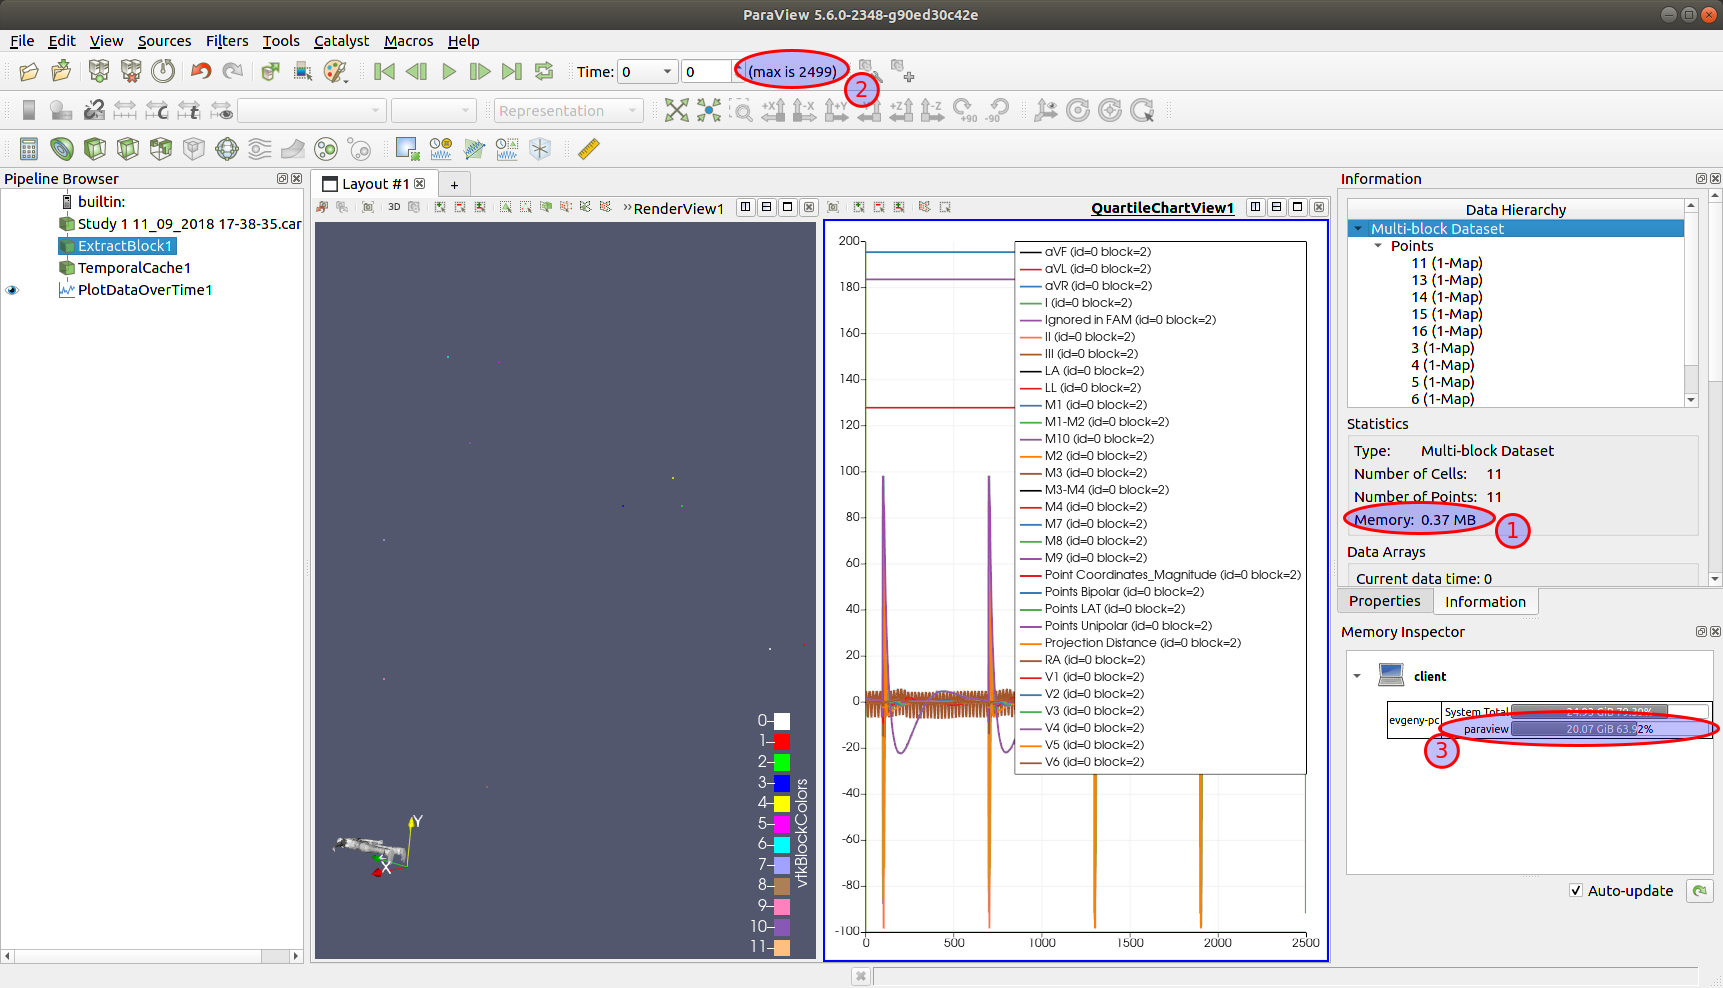
This is a great result. But at the same time, the cache unexpectedly takes up a lot of space (see picture).
I expected the total cache size to be approximately equal:
Total(3) = MemoryOfBlock(1) * CountOfSteps(2)
but
MemoryOfBlock(1) * CountOfSteps(2) = 1GB and Total = 20 GB
I don’t understand why.
Not sure to understand, what value do you put in your temporal cache ? how many timesteps do you cache ?
I apply ‘Temporal Cache’ filter to ‘Extract Block’ filter that consist of vtkMultiblockDataset with 11 bocks of vtkPolyData with 30 vtkFloatArray (total memory of block = 0,37 MB). I cache 2500 timesteps.
The trick is to decimate the timesteps. For instance, try this:
- can.exo. All vars on, apply.
- Extract Time Steps. Delete the Range Value of 0, then click on the little graph’y thing (looks like a bed frame) right side. Take defaults, which will return 10 timesteps. Apply.
- Plot Data Over Time filter. Apply.
Note that the Plot Data Over Time filter defaults to only the first block. You may need to turn on more blocks.
Does that help?
Thanks, Walter. Unfortunately, this solution did not suit me. I implemented caching and some additional logic inside the reader.