Hi Mat,
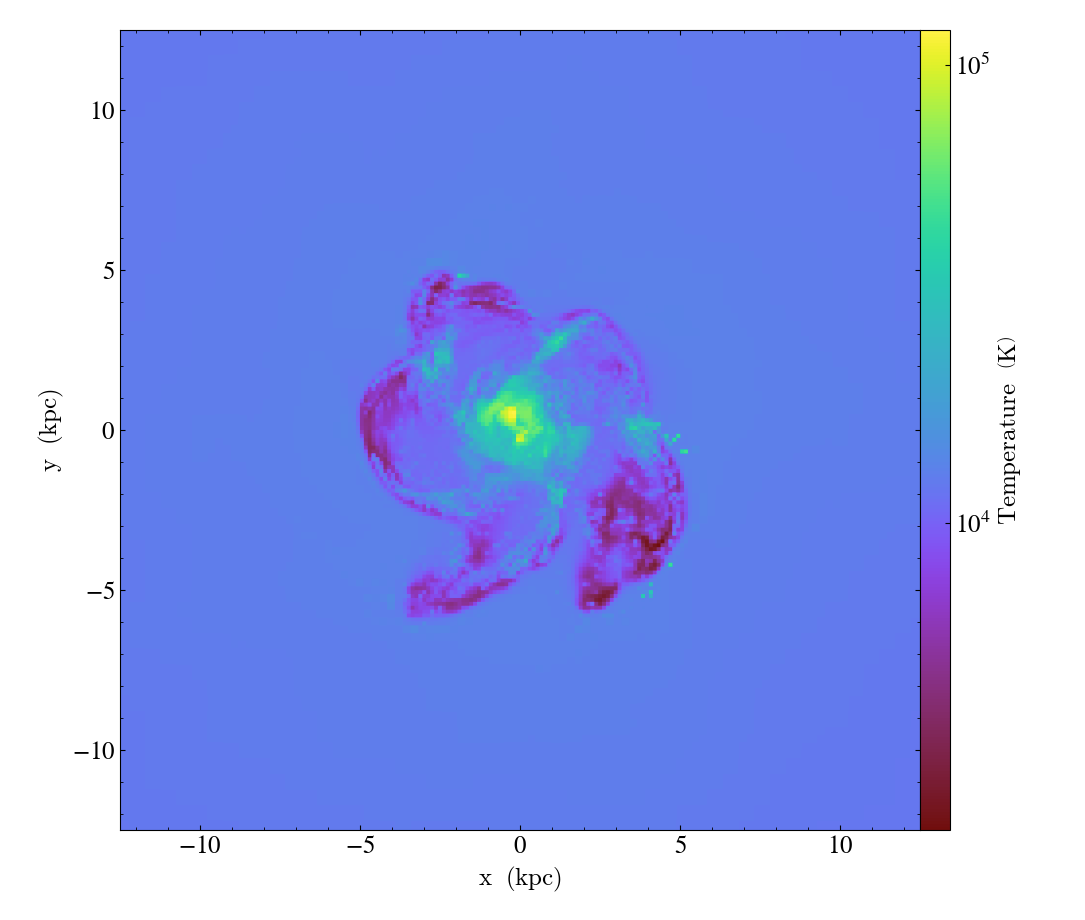
Here is the code. I tried to make a vtkImageData of the filter. For comparing, I was also creating a matplotlib figure on the array which I’m creating for the vtk data. I get the correct expected image in matplotlib figure but not for the vtkImageData on Paraview (very strange behavior at the boundary). Can you please have a look at this and also comment on the efficiency on large datasets run on parallel client-server interface?
I’m new to vtk data structures. Any suggestion will be really helpful.
from paraview.vtk.numpy_interface import dataset_adapter as dsa
from paraview.vtk.numpy_interface import algorithms as algs
import vtk
import vtk.util.numpy_support as ns
import numpy as np

pdi = inputs[0]
verbose = True
normal = 'x'

if verbose:
    print(pdi.VTKObject)
    print('Data fields in the file: ',pdi.PointData.keys())


#get a hold of the input
numPts = pdi.GetNumberOfPoints()
dimensions = pdi.GetDimensions()
extent = pdi.GetExtent()
spacing = pdi.GetSpacing()
xmin, xmax, ymin, ymax, zmin, zmax = pdi.GetBounds()

#create the output dataset
ido = self.GetImageDataOutput()
resolution = None

if (normal=='x'):
    resolution = (extent[3]-extent[2],extent[5]-extent[4]) #pixel for the projection plot
    resolution = (1,*resolution)
    ido.SetDimensions(1,resolution[1],resolution[2])
    ido.SetExtent(0,0,0,resolution[1],0,resolution[2])
    ido.SetSpacing(0,spacing[1],spacing[2])
elif (normal=='y'):
    resolution = (extent[1]-extent[0],extent[5]-extent[4]) #pixel for the projection plot
    resolution = (resolution[0],1,resolution[1])
    ido.SetDimensions(resolution[0],1,resolution[2])
    ido.SetExtent(0,resolution[0],0,0,0,resolution[2])
    ido.SetSpacing(spacing[0],0,spacing[2])
elif (normal=='z'):
    resolution = (extent[1]-extent[0],extent[3]-extent[2]) #pixel for the projection plot
    resolution = (*resolution,1)
    ido.SetDimensions(resolution[0],resolution[1],1)
    ido.SetExtent(0,resolution[0],0,resolution[1],0,0)
    ido.SetSpacing(spacing[0],spacing[1],0)


ido.SetOrigin(*pdi.GetPoint(0))
ido.AllocateScalars(vtk.VTK_DOUBLE,1)
origin = pdi.GetPoint(0)

#choose an input point data array the projection of which is to be made
ivals = pdi.PointData['density']
ivals = np.reshape(ivals,(dimensions[0],dimensions[1],dimensions[2]),order='F')
weight = pdi.PointData['total_energy'] #np.ones(numPts , dtype=np.float64)
weight = np.reshape(weight,(dimensions[0],dimensions[1],dimensions[2]),order='F')

#All cells are assumed to be of uniform size in data
if (normal=='x'):
    proj_img = np.zeros((resolution[1],resolution[2]),dtype=np.float64)
    weight_img = np.zeros((resolution[1],resolution[2]),dtype=np.float64)

    for i in range(resolution[1]):
        for j in range(resolution[2]):
            proj_img[i,j] = np.sum(ivals[:,i,j]*weight[:,i,j])
            weight_img[i,j] = np.sum(weight[:,i,j])
            proj_img[i,j] = proj_img[i,j]/weight_img[i,j]
            ido.SetScalarComponentFromDouble(0,i,j, 0, proj_img[i,j])

if (normal=='y'):
    proj_img = np.zeros((resolution[0],resolution[2]),dtype=np.float64)
    weight_img = np.zeros((resolution[0],resolution[2]),dtype=np.float64)

    for i in range(resolution[0]):
        for j in range(resolution[2]):
            proj_img[i,j] = np.sum(ivals[i,:,j]*weight[i,:,j])
            weight_img[i,j] = np.sum(weight[i,:,j])
            proj_img[i,j] = proj_img[i,j]/weight_img[i,j]
            ido.SetScalarComponentFromDouble(i,0,j, 0, proj_img[i,j])

if (normal=='z'):
    proj_img = np.zeros((resolution[0],resolution[1]),dtype=np.float64)
    weight_img = np.zeros((resolution[0],resolution[1]),dtype=np.float64)

    for i in range(resolution[0]):
        for j in range(resolution[1]):
            proj_img[i,j] = np.sum(ivals[i,j,:]*weight[i,j,:])
            weight_img[i,j] = np.sum(weight[i,j,:])
            proj_img[i,j] = proj_img[i,j]/weight_img[i,j]
            ido.SetScalarComponentFromDouble(i,j,0, 0, proj_img[i,j])

np.save('D:\\proj_img.npy',proj_img)
import matplotlib.pyplot as plt
if(normal=='x' or normal=='y'): plt.figure(figsize=(16,32))
else: plt.figure(figsize=(16,16))
plt.pcolor(proj_img.T)
plt.savefig('D:\\test-img-proj.png')


#
# This part of the code is to be placed in the "RequestInformation Script" entry:
#

from paraview import util

pdi = inputs[0]
pdi = self.GetInput()
ido = self.GetOutput()
extent = pdi.GetExtent()

dimensions = pdi.GetDimensions()
normal = 'x'

if (normal=='x'):
    resolution = (extent[3]-extent[2],extent[5]-extent[4]) #pixel for the projection plot
    resolution = (1,*resolution)
    util.SetOutputWholeExtent(self,[0,0,0,resolution[1],0,resolution[2]])
elif (normal=='y'):
    resolution = (extent[1]-extent[0],extent[5]-extent[4]) #pixel for the projection plot
    resolution = (resolution[0],1,resolution[1])
    util.SetOutputWholeExtent(self,[0,resolution[0],0,0,0,resolution[2]])
elif (normal=='z'):
    resolution = (extent[1]-extent[0],extent[3]-extent[2]) #pixel for the projection plot
    resolution = (*resolution,1)
    util.SetOutputWholeExtent(self,[0,resolution[0],0,resolution[1],0,0])
Also on changinng normals variable and hitting Apply makes the output on Paraview produce plots with garbage values. Then changing OutputDataType from vtkImageData to Same as input sometimes I’m getting the correct result (although with the boundary issues) but sometimes that isn’t working as well. This is seems wierd and pretty unexpected.
Here’s the state: proj-filter-testing.pvsm (608.2 KB)
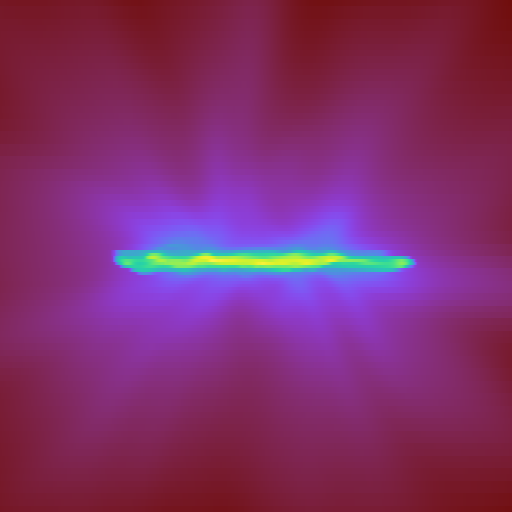
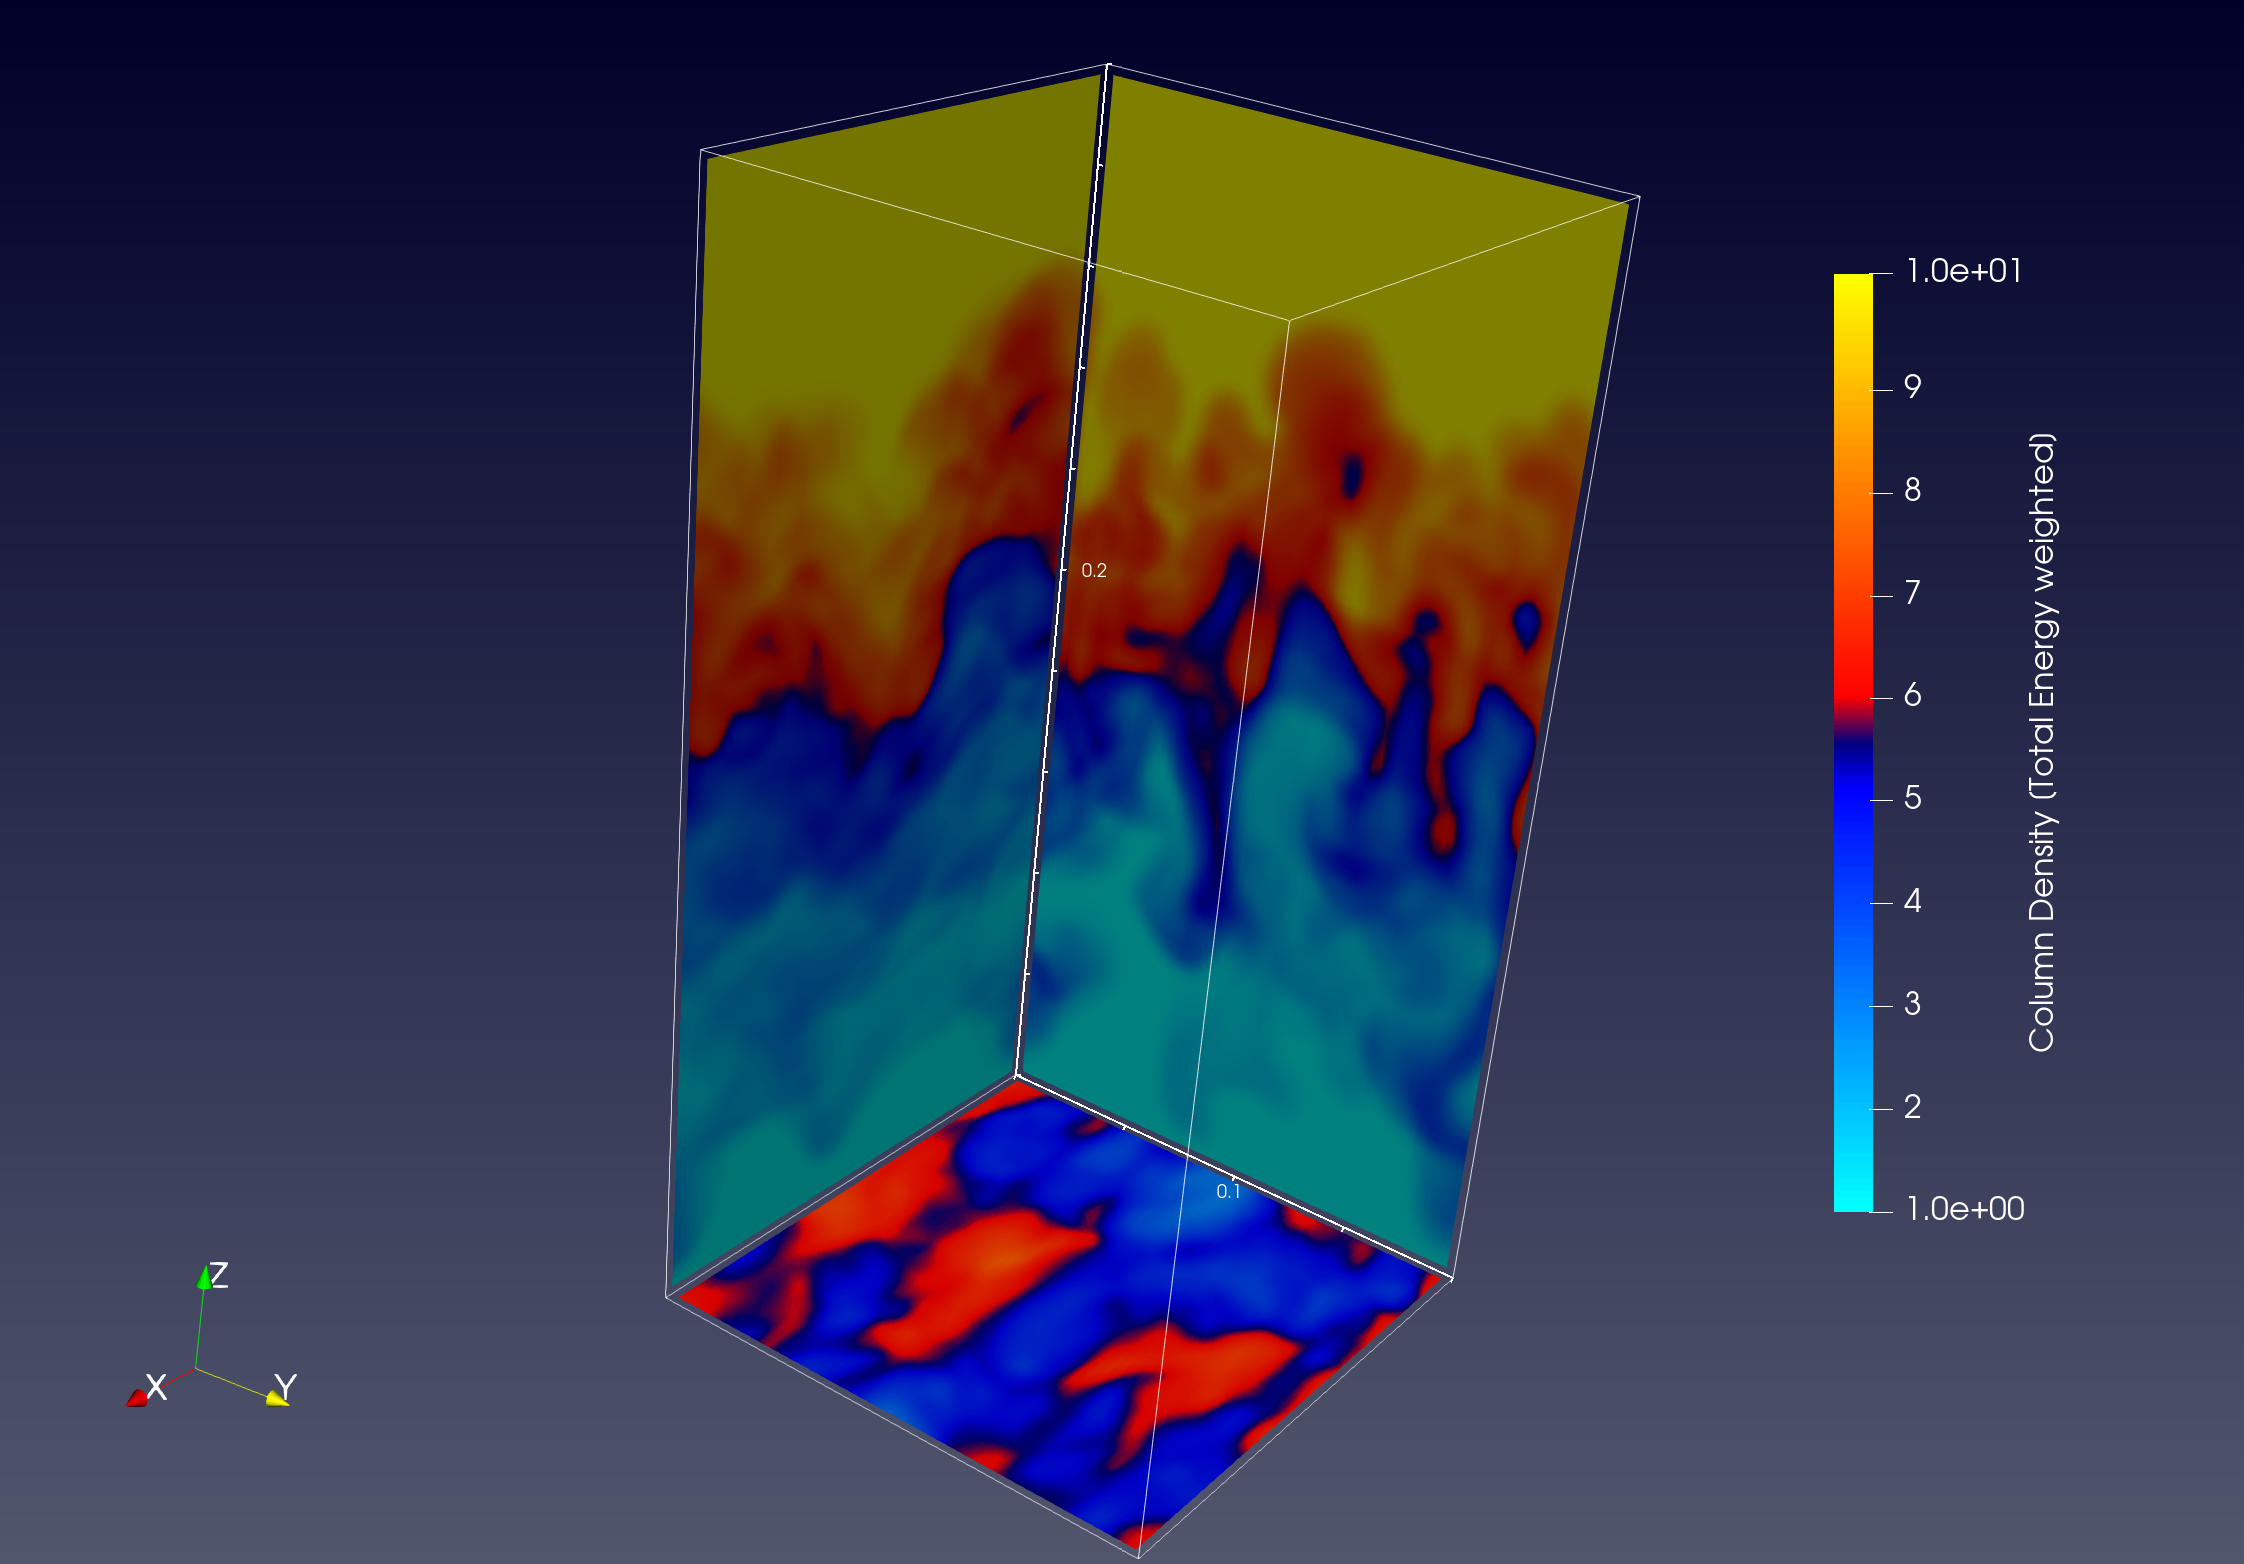
Here as I was saying, you can see some nan-values (“red” in both plots) produced at the edges creating some strange artifacts not present in the numpy array.
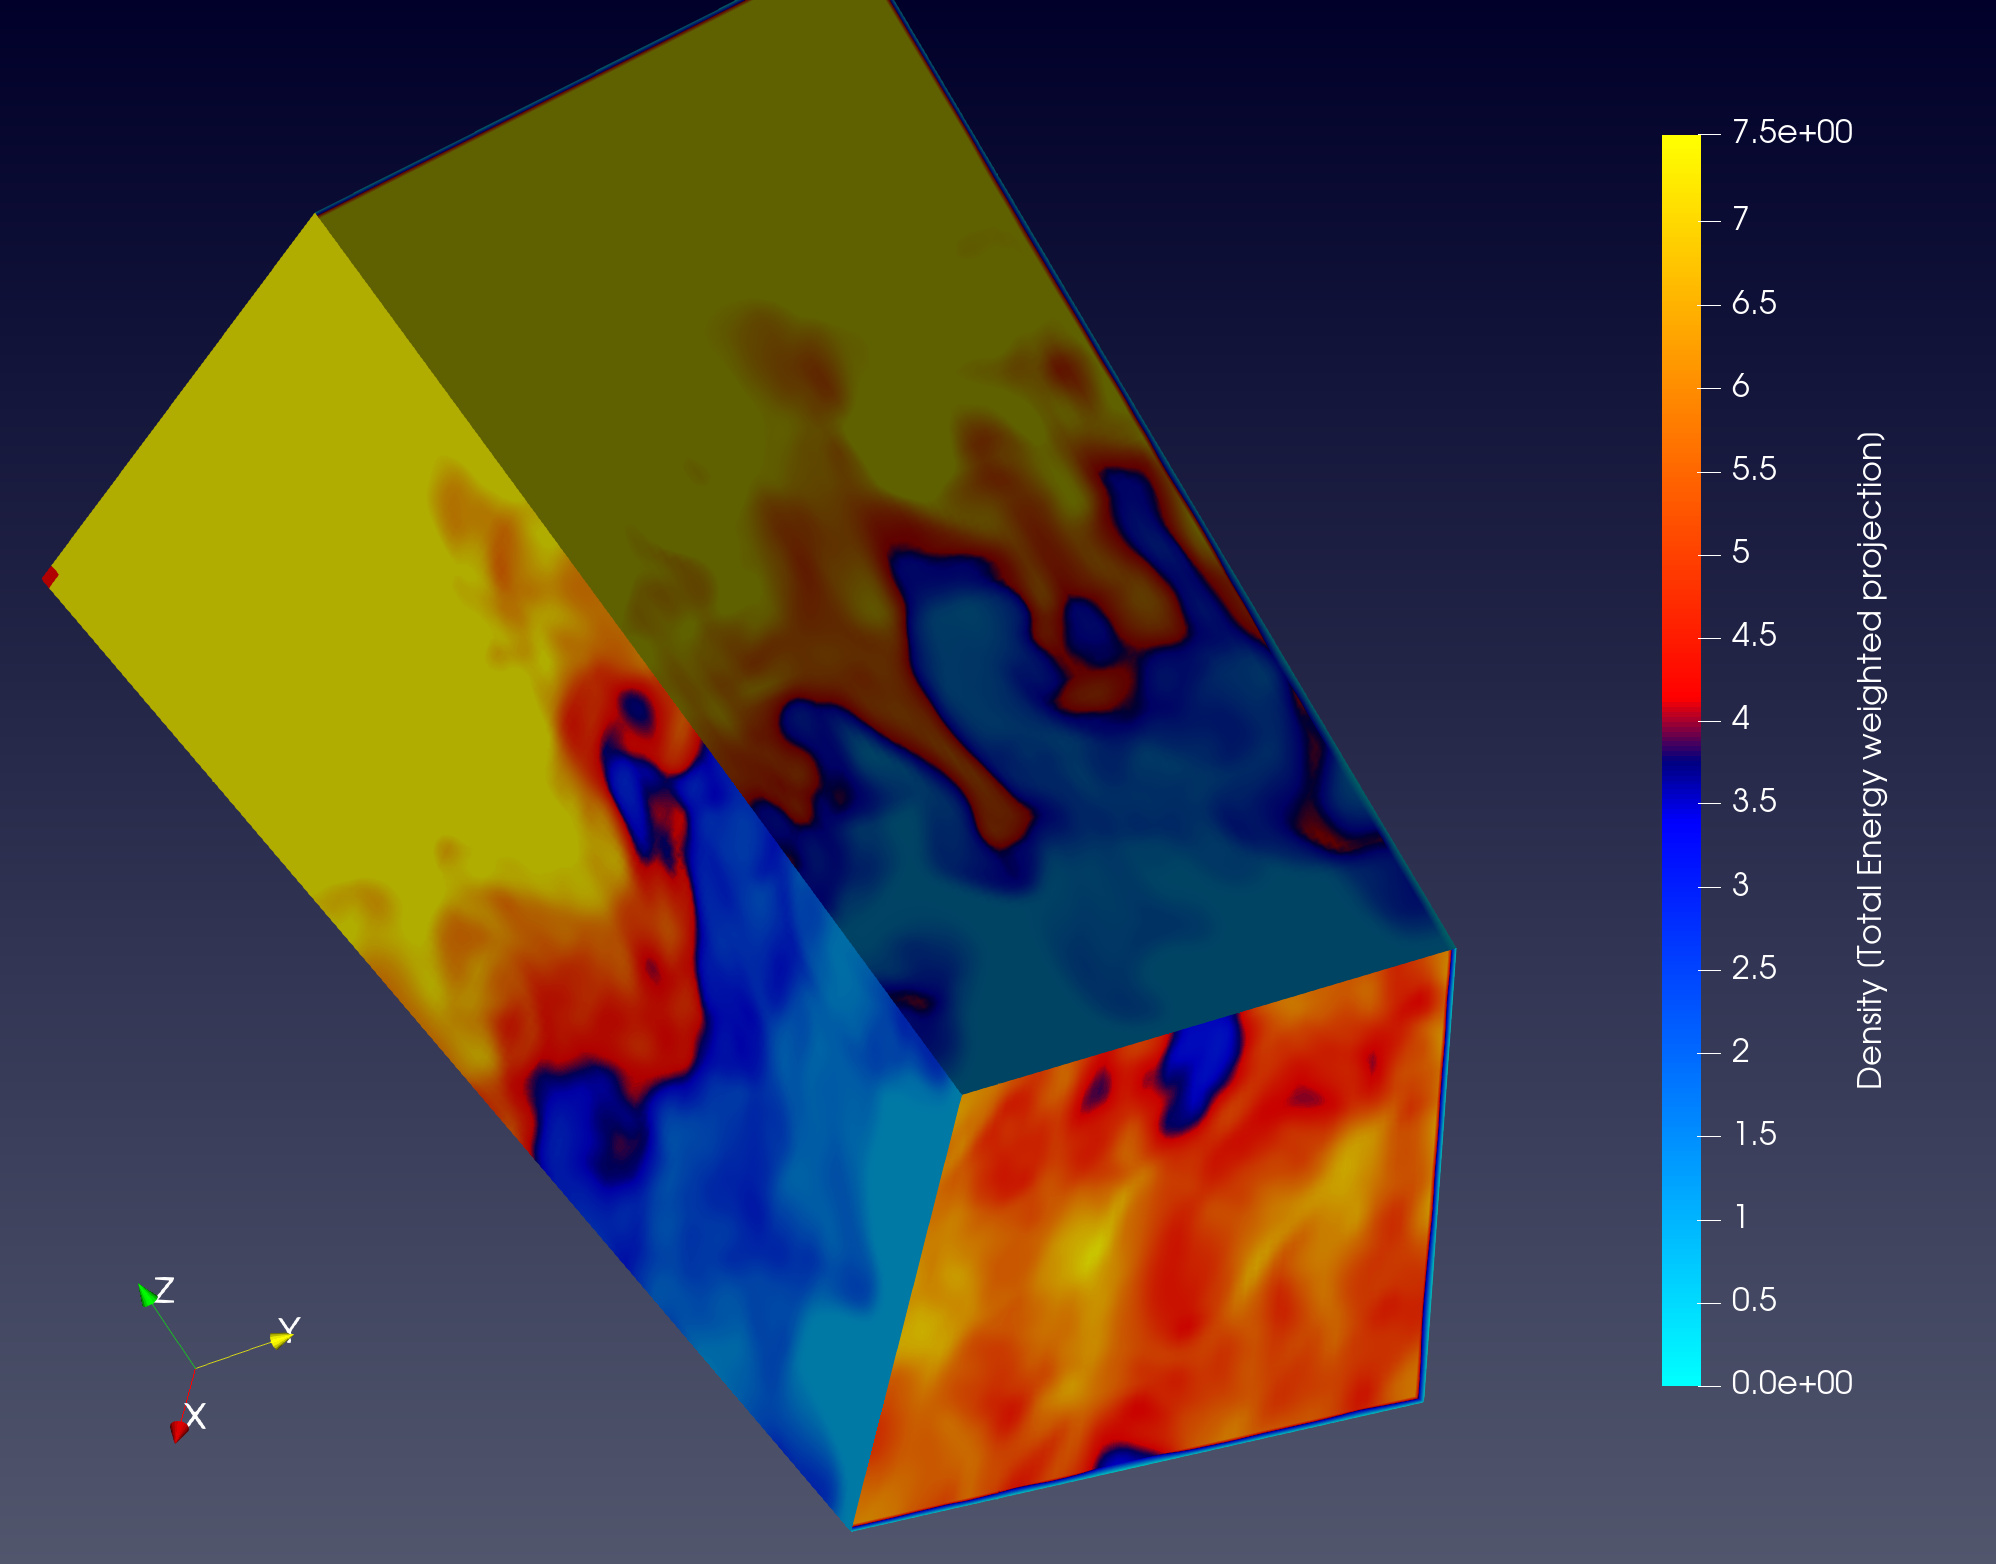
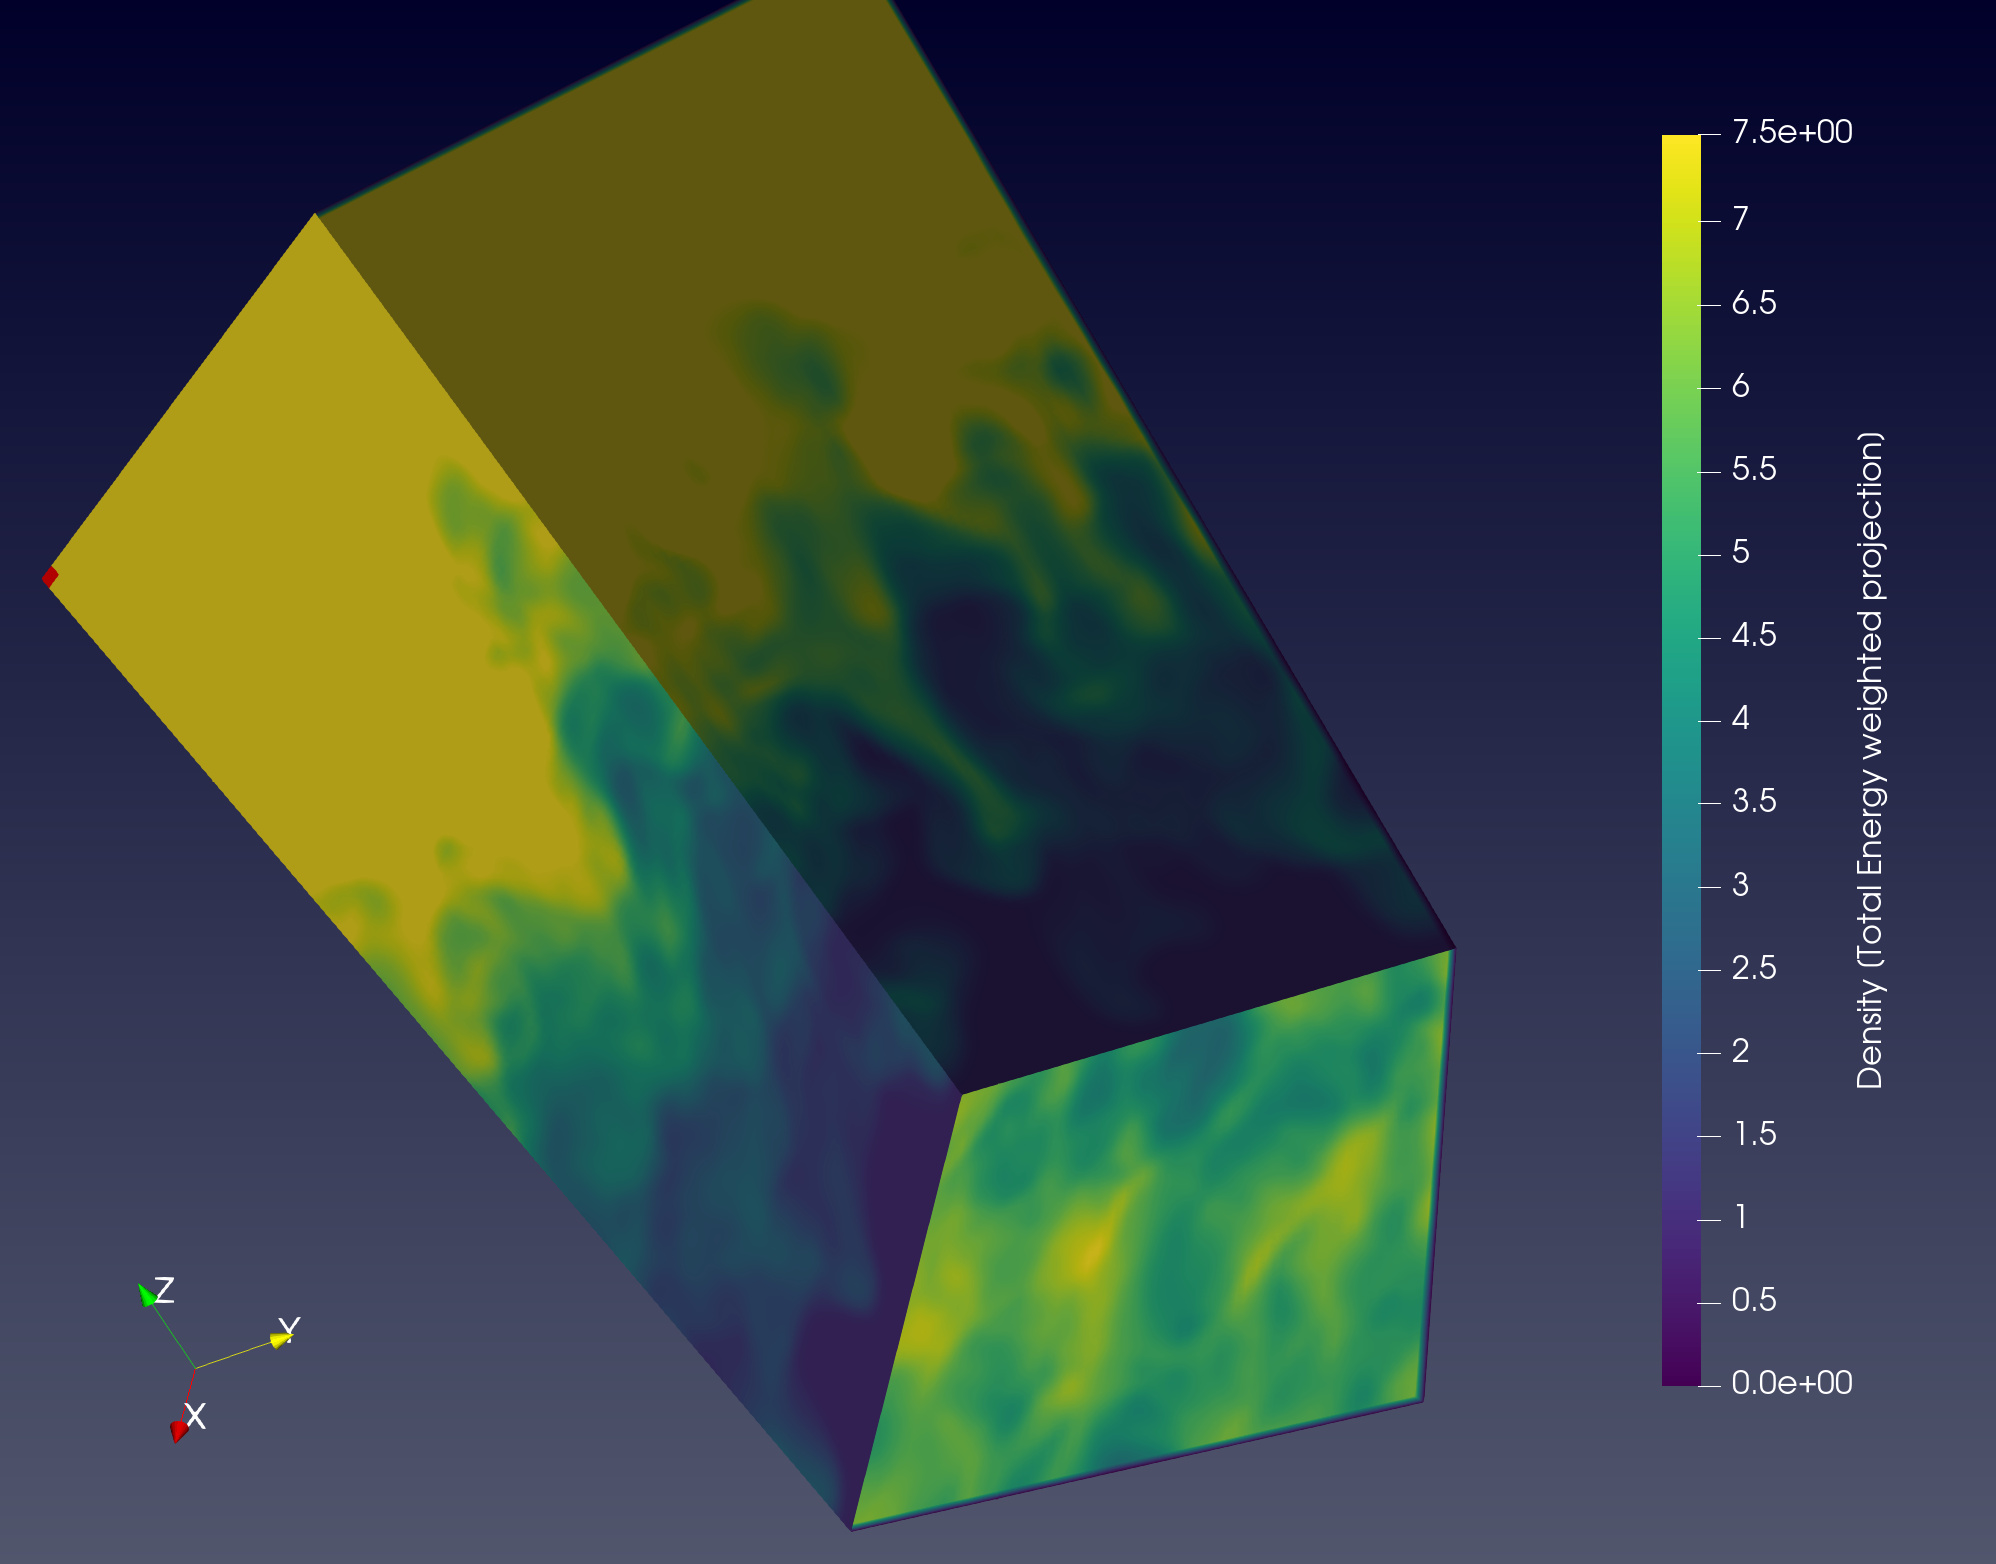
One really hacky unelegant way of doing this is applying ExtractSubset to negelect the edge. But doesn’t solve this problem. As is done in the following figure where you can see that the edges are clipped off that gave problemtic Nan values: