hi ,how can I display the color to distinguish the most blue part.Thank you very much.

An easy solution might be to apply log scaling in the colors.
Do you have any other methods? the log scaling do a little better.
OK.I think I should editor the color map.
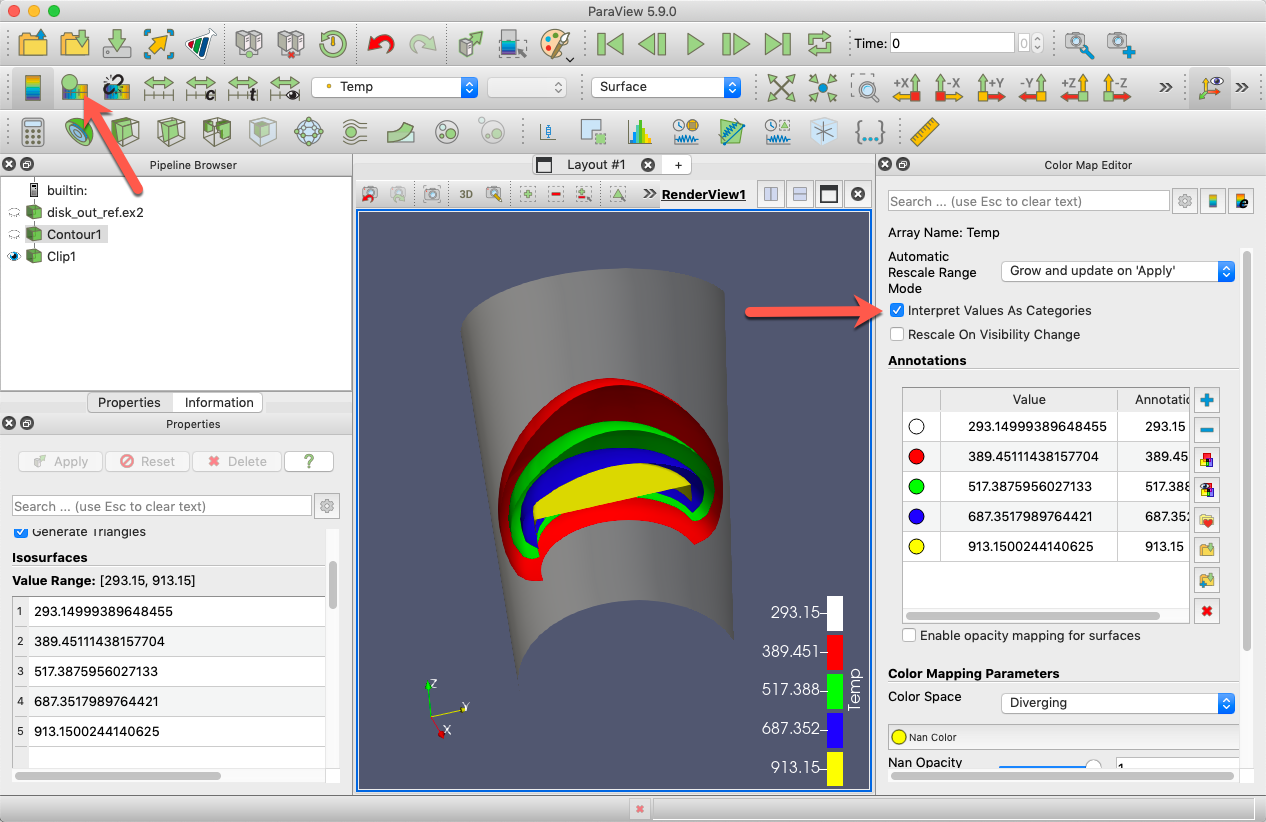
It looks like you are taking several contours of your data and then coloring by the field you are contouring on. So each contour has the same value. If that is the case, you can opening the color editor and turning on the Interpret Values As Categories button. That should allow you to select a color for each contour. You can also select from some pre-made color categories, some of which have sequential meaning.