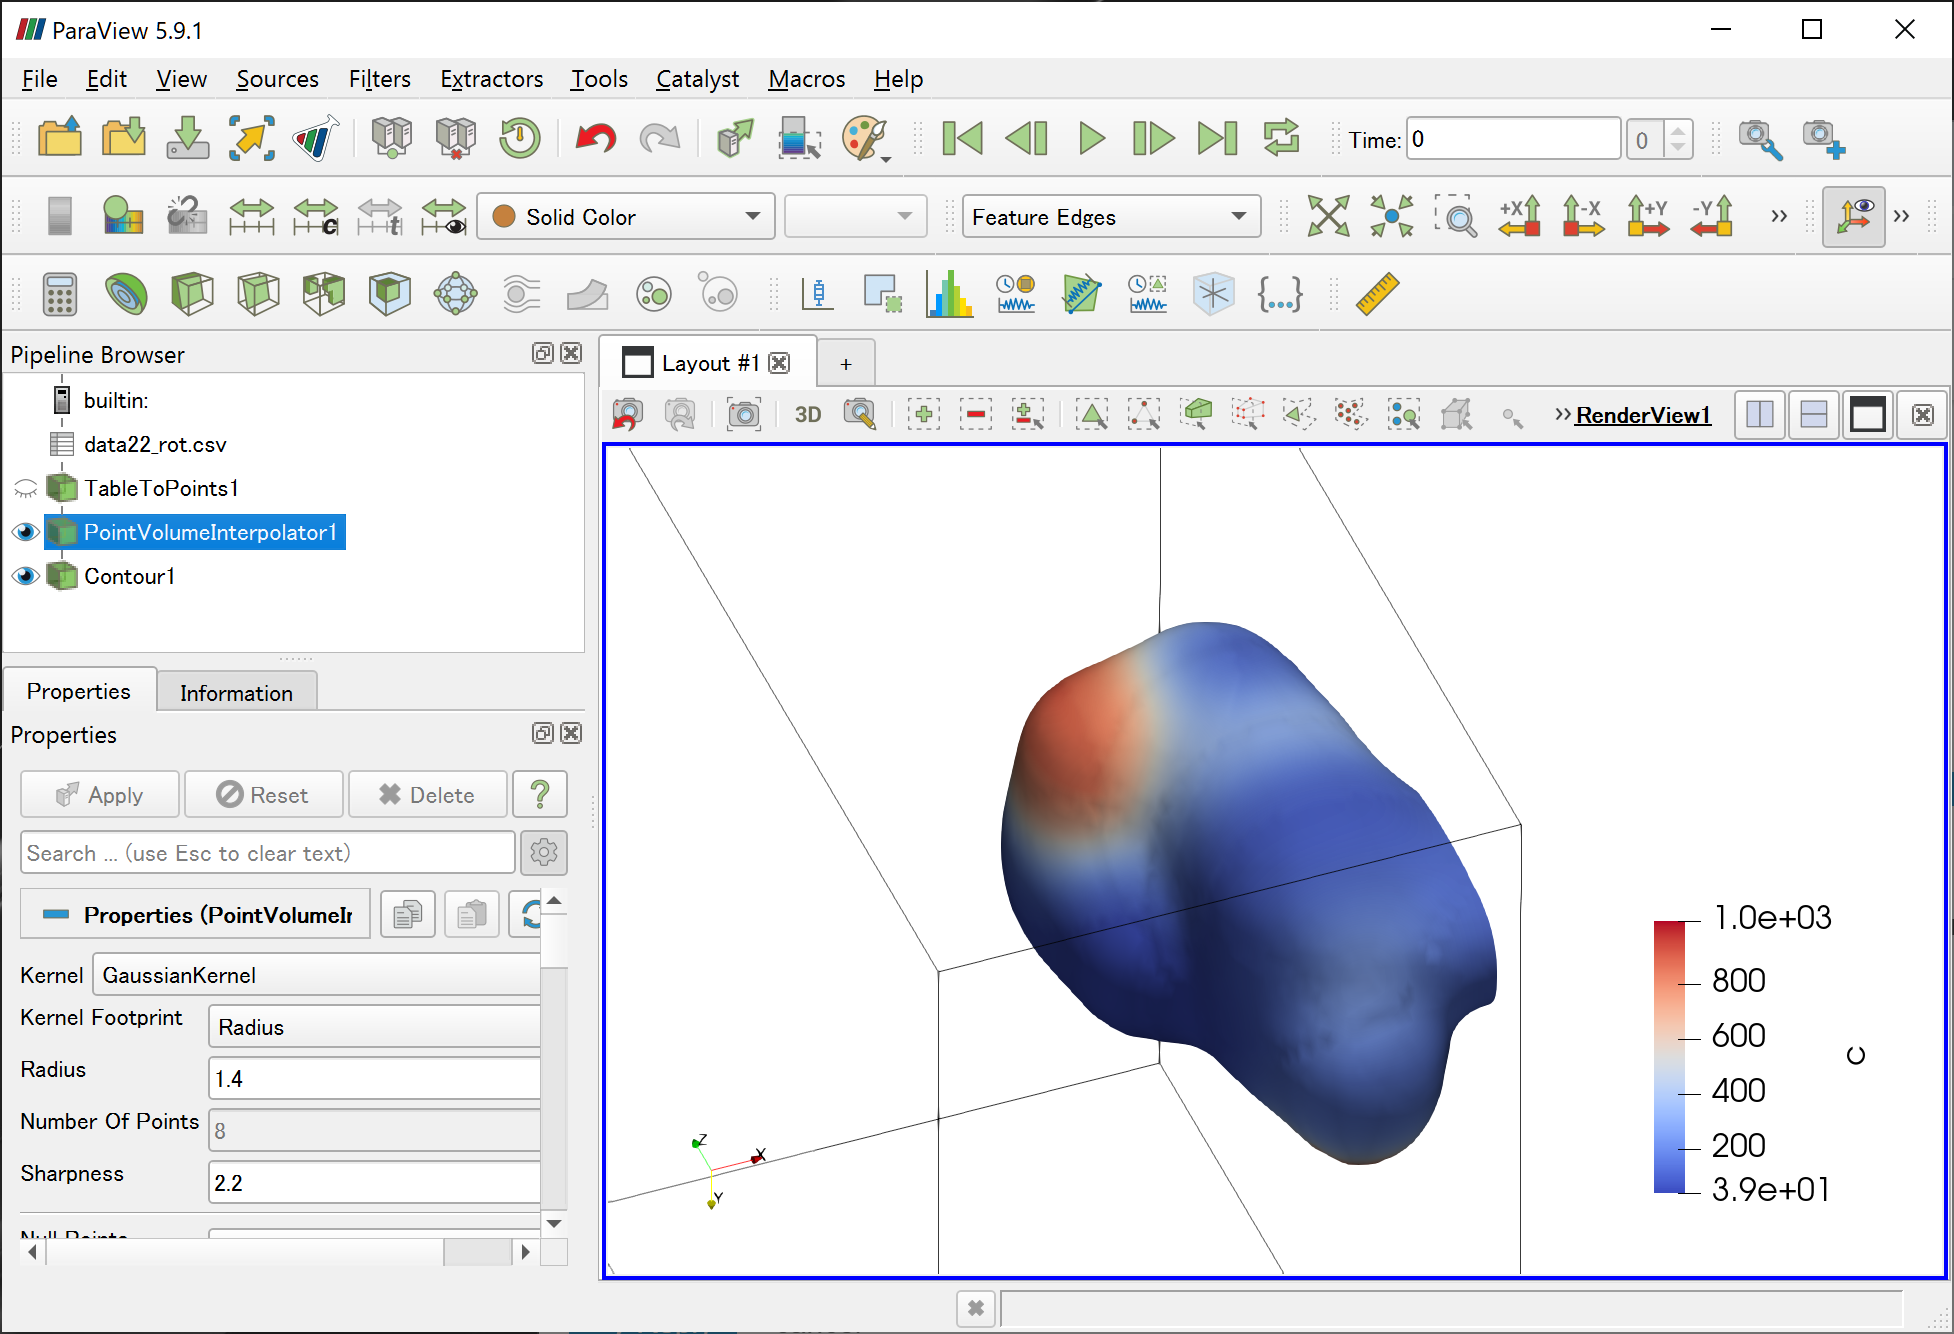
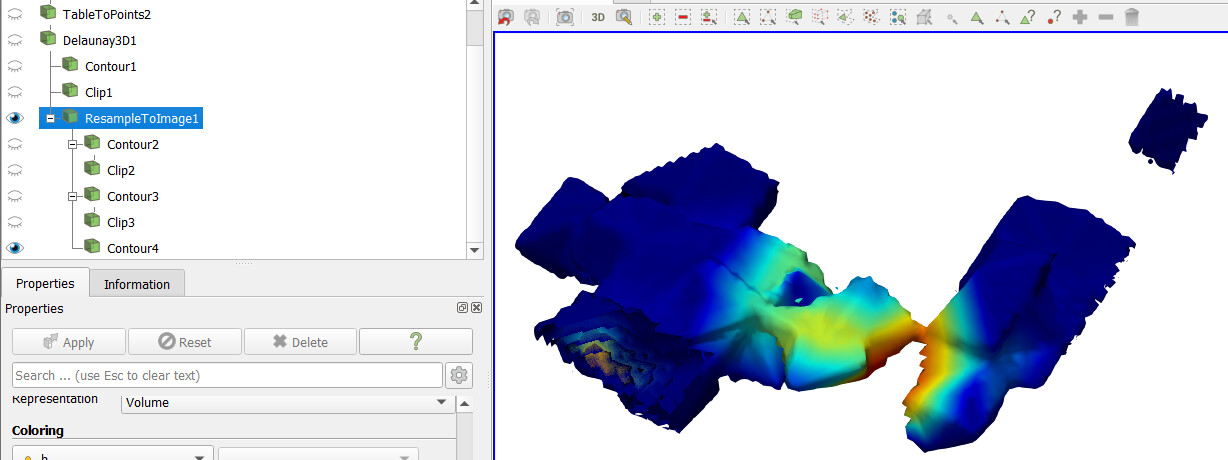
The sizes may be too large that the plot is so ugly.
How can plot these data to smooth the isosurface?
data11.csv (2.1 KB)
data22.csv (23.6 KB)

Thank you very much.
The sizes may be too large that the plot is so ugly.
How can plot these data to smooth the isosurface?
data11.csv (2.1 KB)
data22.csv (23.6 KB)