I am simulating the flow within a U-shape tube. I am going to visualize the streamwise vorticity contour in a plane normal to tube axis. However, the velocity components are in the Cartesian coordinates. I would be wondering if you could guide me how to solve this issue.
So, if I understand correctly, with w the vorticity and n the normal to your plane, you would like to visualize iso-contours of the scalar field w \cdot n.
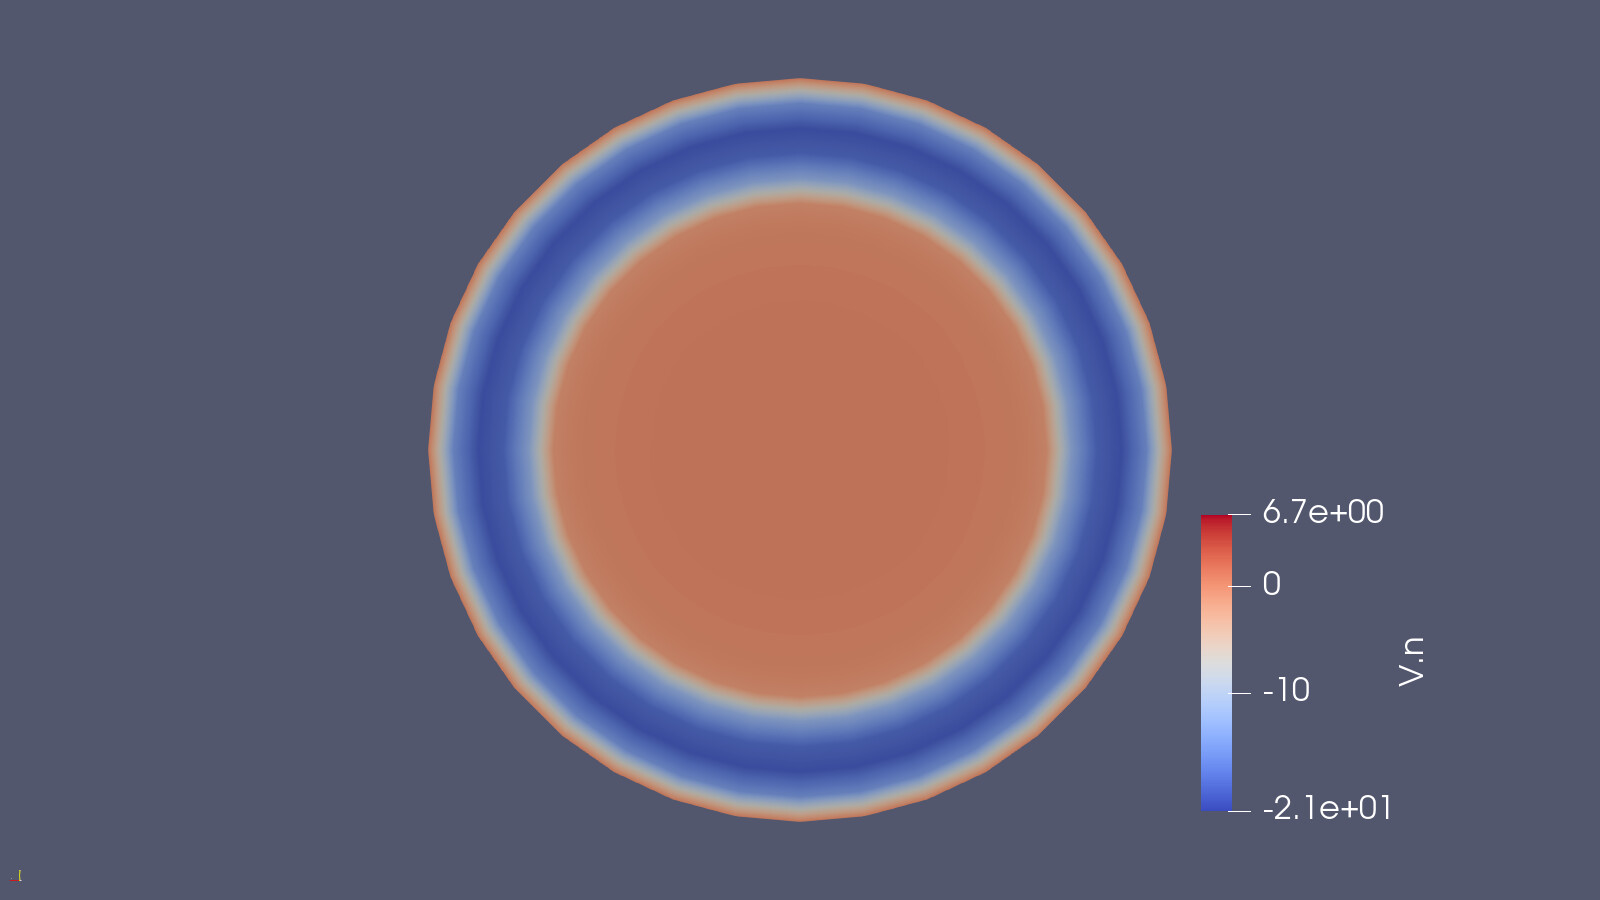
Thanks for your response and sorry for the confusion. Yes, something like the 2D colorful contours of a circular cross section depicted in the article entitled as “Reducing the data: Analysis of the role of vascular geometry on blood flow patterns in curved vessels”
in Fig 4 (d, e and f) without streamlines. I want to visualize these contours for a U-shape tube.
First use the “Python Calculator” to project the vector field in a given direction (here I use the Z direction but you can imagine using any other vector field such as the n field in your case)
Then you can use the "Slice¨ filter to interpolate the data set onto a 2D plane (you can use the widget in the render view to place this plane manually or control its exact positioning from the properties tab)
Thanks for your response and providing the files.
For my case study, I have the velocity components (vx,vy,vz) and need to evaluate the vorticity using the vorticity defintion, i.e., Curl V. However, for the case you have provided, you have aleardy had the vorticity vector. Therefore, you could simply project it into your desired plane. I would be wondering if you could provide me a solution under those conditions.
I see your issue. Unfortunately I do not believe there is a “Curl” filter in ParaView.
There is, however, a tensor “Gradient” filter. You can use this filter on your vector field to get your tensorial valued gradient field. You can then use the “Python Calculator” to sum / subtract the correct components of your tensorial gradient to determine the value of the curl vector field.
I have not been following this thread, however ParaView does include a Vorticity calculation. It is in the Gradient filter, then Advanced (the little gear next to the search). With regards to Curl, this is trivial to do with the Python Calculator. See the users guide for details (Help menu, ParaView Guide).