I’m visualizing an SPH simulation in ParaView using .vtu files with multiple time steps.
I would like to plot the time evolution of a variable ( like pressure or Z-variation because it’s a fluid simulation) at a fixed spatial point.
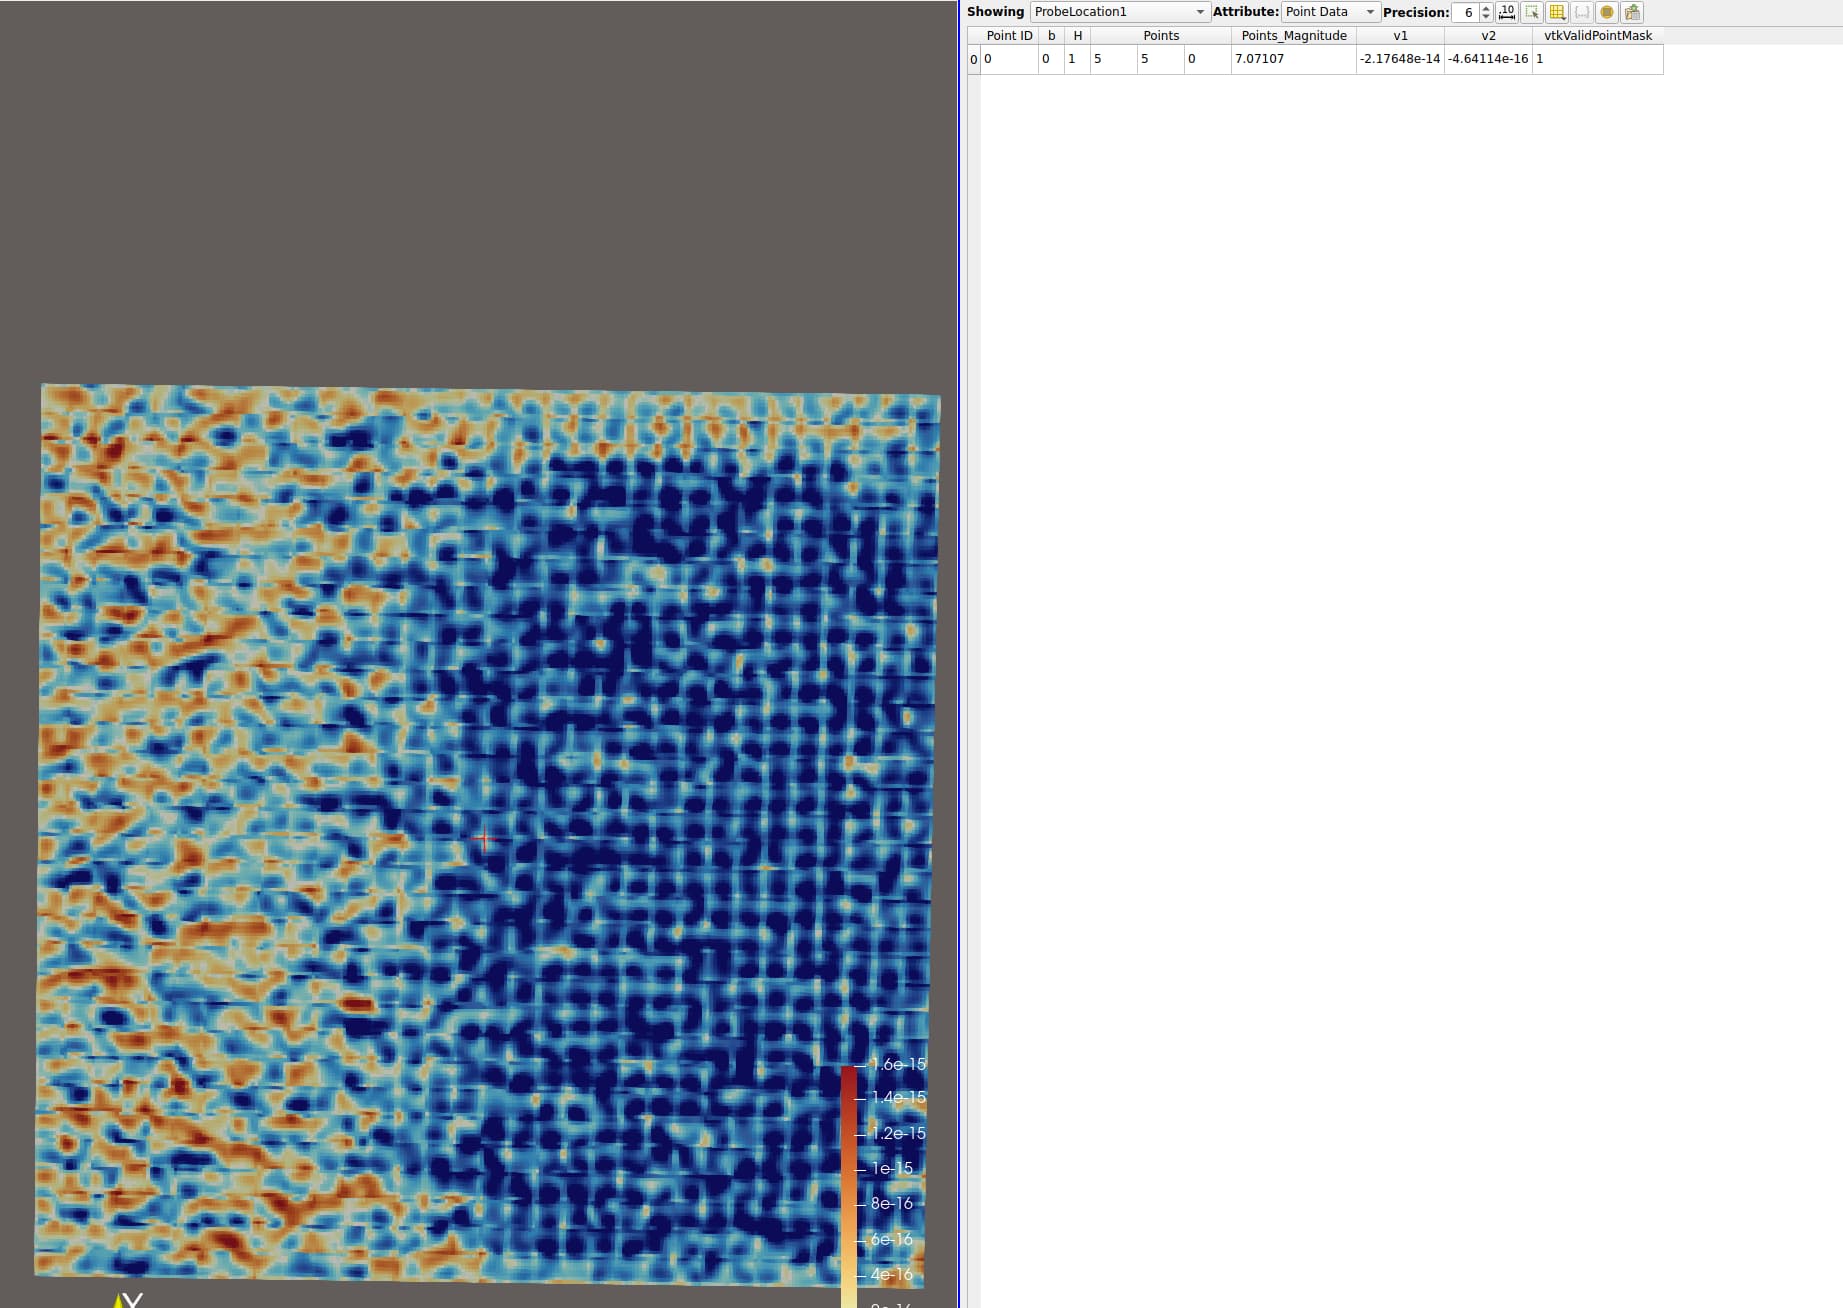
I tried using Probe Location and Plot Data Over Time, but I only get constant or zero values.
What is the best way to extract interpolated time series data at a given point in SPH simulations?
version 5.13.3
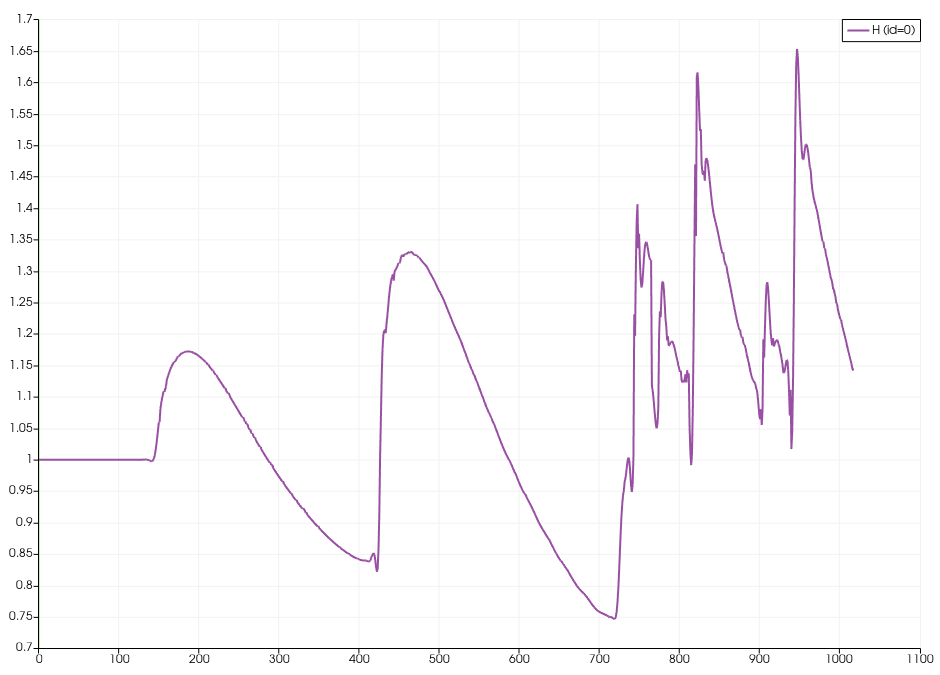
Now I’m not sure if I used the filters properly , from the résults you got , is it possible to plot a simple graph of ‘H’ over the time in specific distance ?