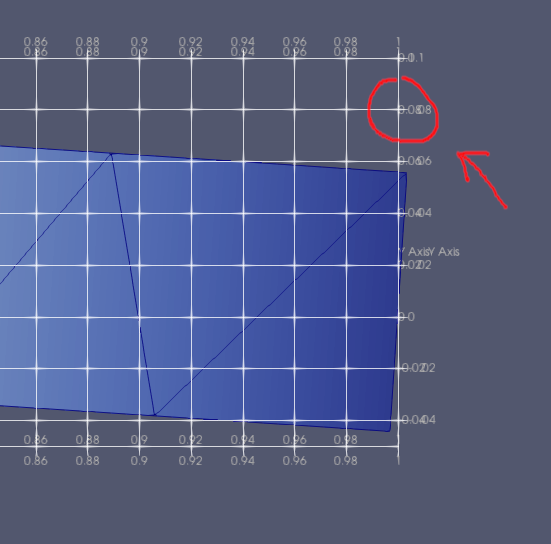
I don’t know why there are two ticks in the same positions and how to remove one of them. I found no answer in the tutorials. Please help me, thanks.
Welcome to the ParaView community support!
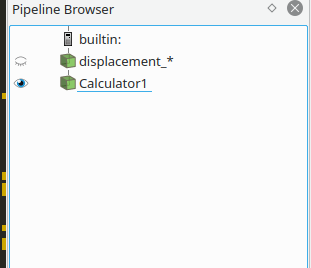
This looks like you are drawing two different filters at the same time. What does your pipeline browser look like?
Alan

Two thoughts.
- I believe I see a bug in ParaView. For me, the annotations aren’t showing up on front faces with Axis Grid. I will write it up Monday.
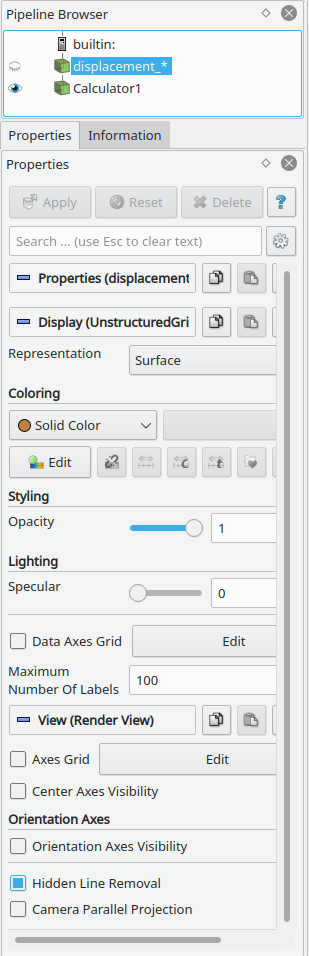
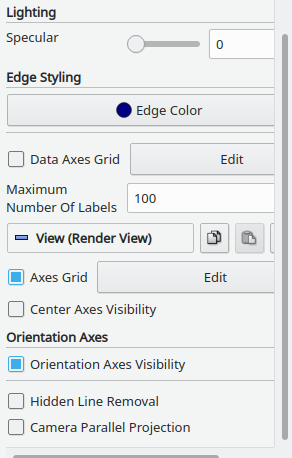
- I suspect that you are drawing two different data axis grids, around each of the two items in the pipeline browser. Try turning off the data axis grid, and turn on axis grid.
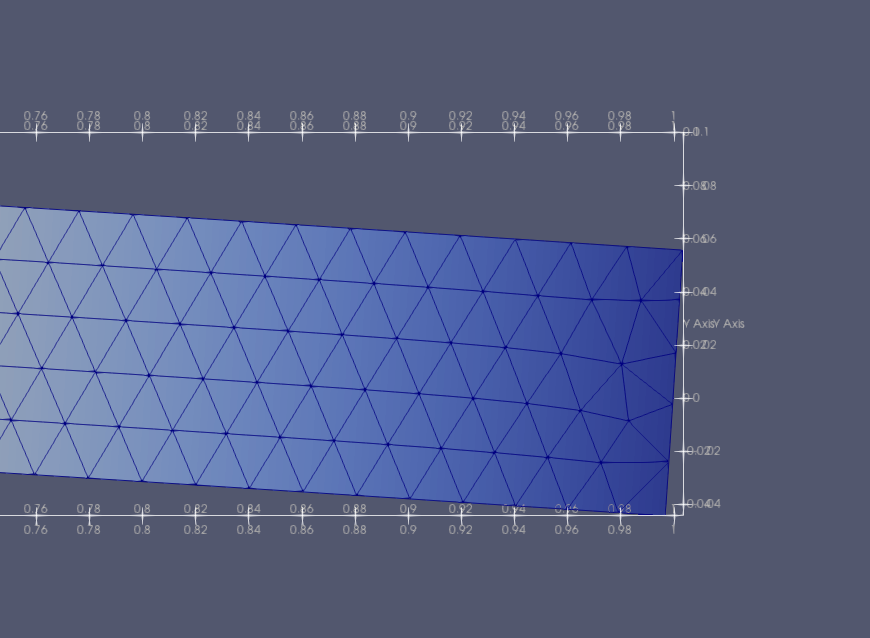
I turned off the “data axes grid” of both items in the pipepine browser, but it didn’t solve the problem.
bar.pvsm (256.2 KB)
This is the state file.
Walnut,
A dataset without the data doesn’t work too well. Mind adding your data?
The bug that I found is reported here: https://gitlab.kitware.com/paraview/paraview/-/issues/20296