Hello everyone!
I have 16 VTK files which just contain the 3D point data. The time interval of these files is 15 minutes. But when I play the annimation, the annotate time is from 1 to 16 seconds. How can I set the annotate time format as “18:00 UT”?
I found a few answers, but they are all about NetCDF files.
TemporalShiftScale filter should do the trick.
But the annotate time in paraview is decimal and date time is sexagesimal. How could transform the timesteps into sexagesimal?
And I also want to show the text “UT”, not just the numbers. Is it possible to show the datetime format like python?
How could transform the timesteps into sexagesimal?
Unsupported.
I also want to show the text “UT”, not just the numbers. Is it possible to show the datetime format like python?
Actually, I misunderstood your question.
In order to show the correct annotate time, you will have to do it manually.
- Compute the right numeric values in a PythonCalculator or a ProgrammableFilter (sexagesimal)
- Use AnnotateAttributeData to show it with the correct formatting
Is there any examples for this? I tried the Annotate Attribute Data filter, but in “select input arrary” , just “Pressure” can be selected. Do I need to link the numeric values to my data? I am a beginner of paraview, I’m totally confued by these operations.
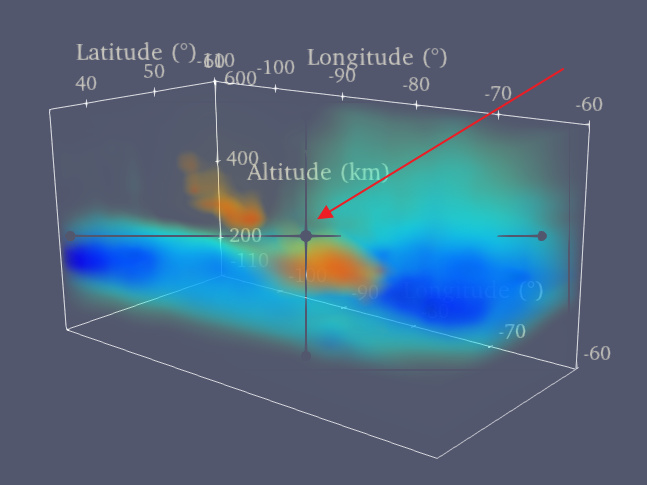
Besides, after I checked the “axes grid” box, there is a gray axis in my annimation as the following figure shows. I checked all the iterms in axes grid, but I didn’t find any thing about the gray axis. do you know how to remove it?
Thank you
Is there any examples for this? I tried the Annotate Attribute Data filter, but in “select input arrary” , just “Pressure” can be selected. Do I need to link the numeric values to my data?
Yes, you need to generate the correct sexagesimal data using the timesteps in a ProgrammableFilter, here is how it could look like :
- Filters → ProgrammableFilter
Then copy this in the script and implement the conversion :
pdo =  self.GetOutput()
sexaTime = vtk.vtkStringArray()
sexaTime.SetName("SexaTime")
t = inputs[0].GetInformation().Get(vtk.vtkDataObject.DATA_TIME_STEP())
timeAsAString = f(t) #compute your time here in python in a string format
sexaTime.InsertNextValue(timeAsString)
pdo.GetFieldData().AddArray(sexaTime)
- Filters → AnnotateAttributeData
- Format your annotation as you wish
What’s the type of “convertedTime” ? It seems I can not set the values of convertedTime directly. If I have to use t to compute time, it’s impossible to get sexagesimal numbers.
Indeed, I’ve edited my post.
OK, that works. Thank you Mathieu.
Do you know how to remove the gray axis? This really bothers me.

When does this grey artifacts appear ? Please share steps to reproduce.
I was using Windows 10 and paraview 5.8. I opened a vtk files group. After I checked the “Axes Grid” box, it appeared. Now I switched to paraview 5.7 and it didn’t occur.
Unable to reproduce here, can you share file to reproduce the issue ?
I am sorry, it’s a part of supporting information of an article which just submitted. Maybe I can share after the publication.
What type is your data ?
Can you try and reproduce with a shareable dataset ?
Sorry for the late reply. I used a shared matlab script to export my data to vtk files.
I exported a list of vtk files which includes random values using the same script. I’m not sure whether these files can reproduce the grey artifacts. The matlab script is uploaded and please find the vtk files in the following link
vtk files
Mat2VTK.m (2.4 KB)