I am visualizing CFD results from a nozzle simulated in OpenFOAM. My colormap shows high temperatures as a white-ish color, as seen below.

Here’s what it looks like with a different colormap:
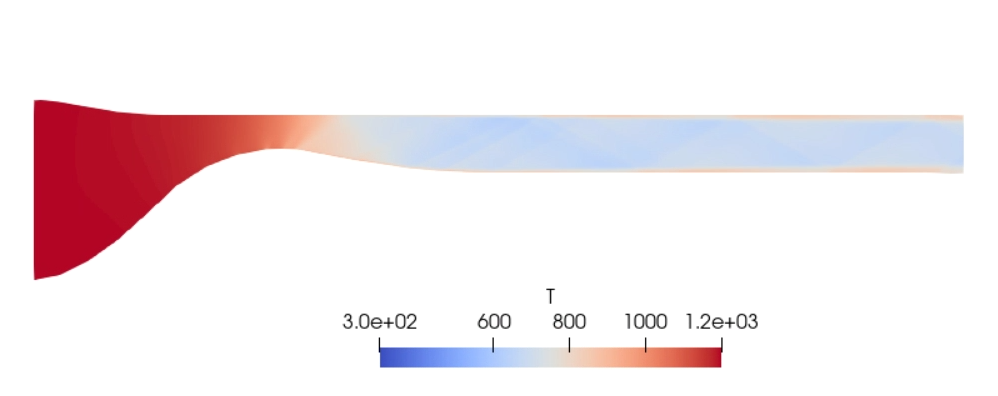
How can I render a boundary around the entire computational domain so that the shape of the nozzle is visible on the left?