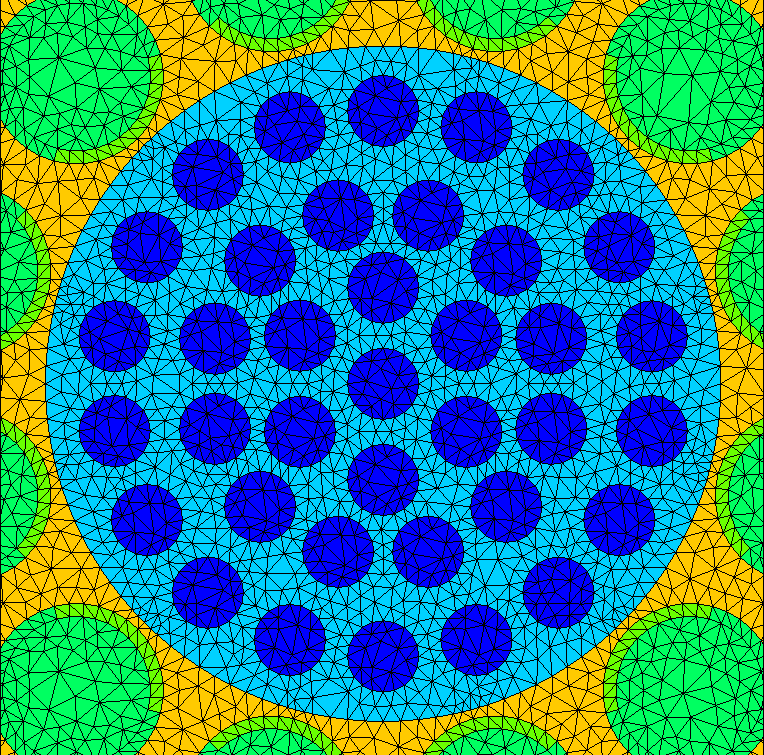
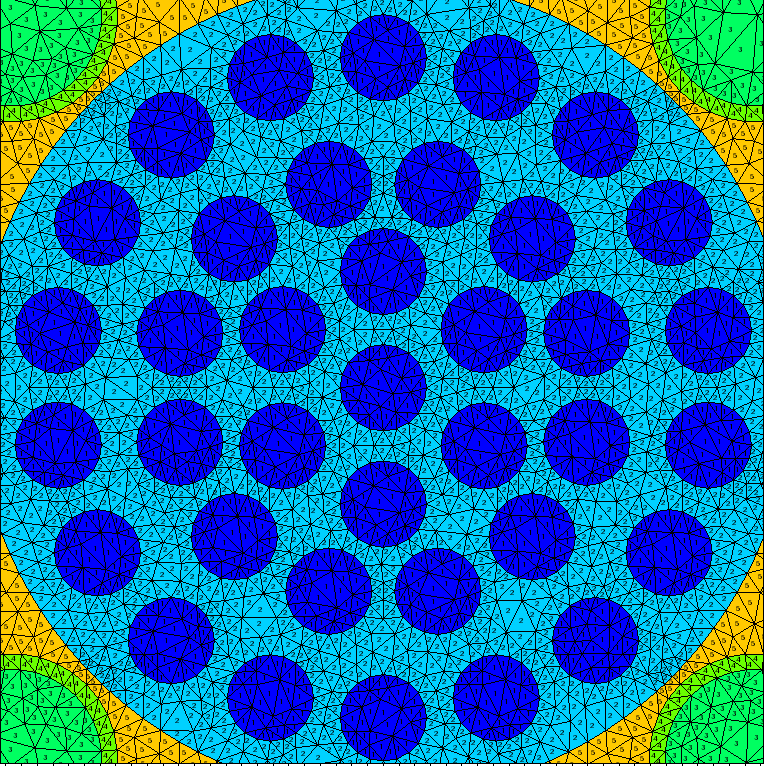
figure 1 and figure 2 are got by using VISIT software. As figure 2 shows, there are material number in the grids. I want to get the same figure by using Paraview. What should I do?
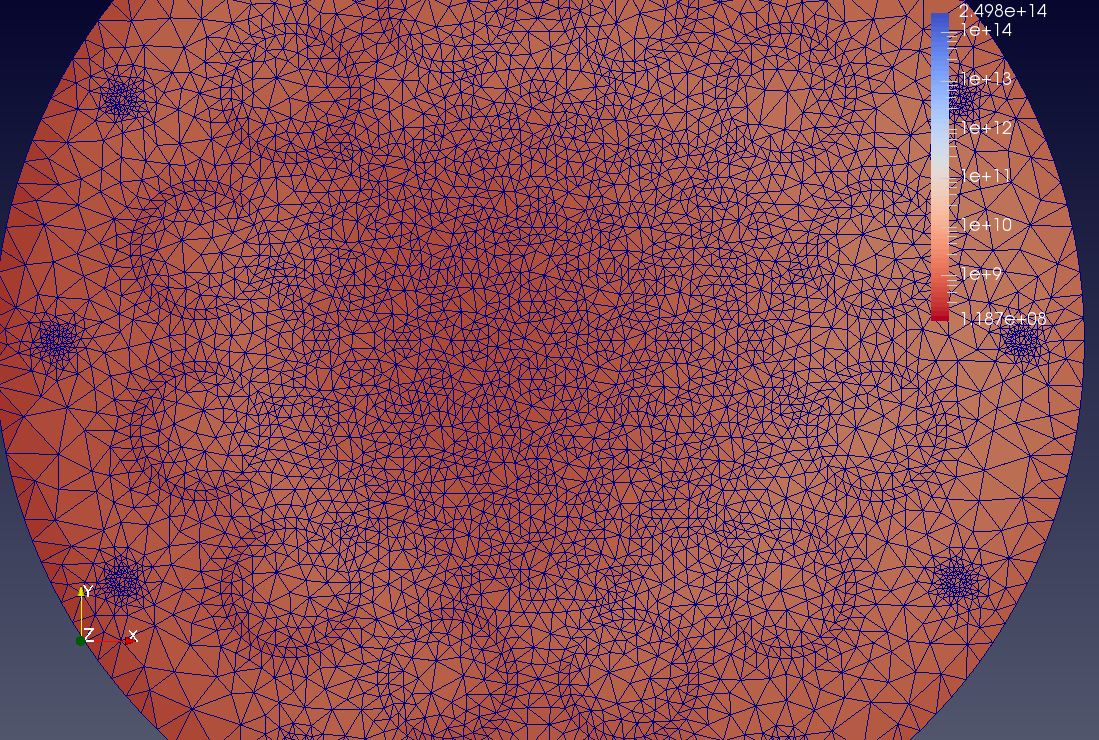
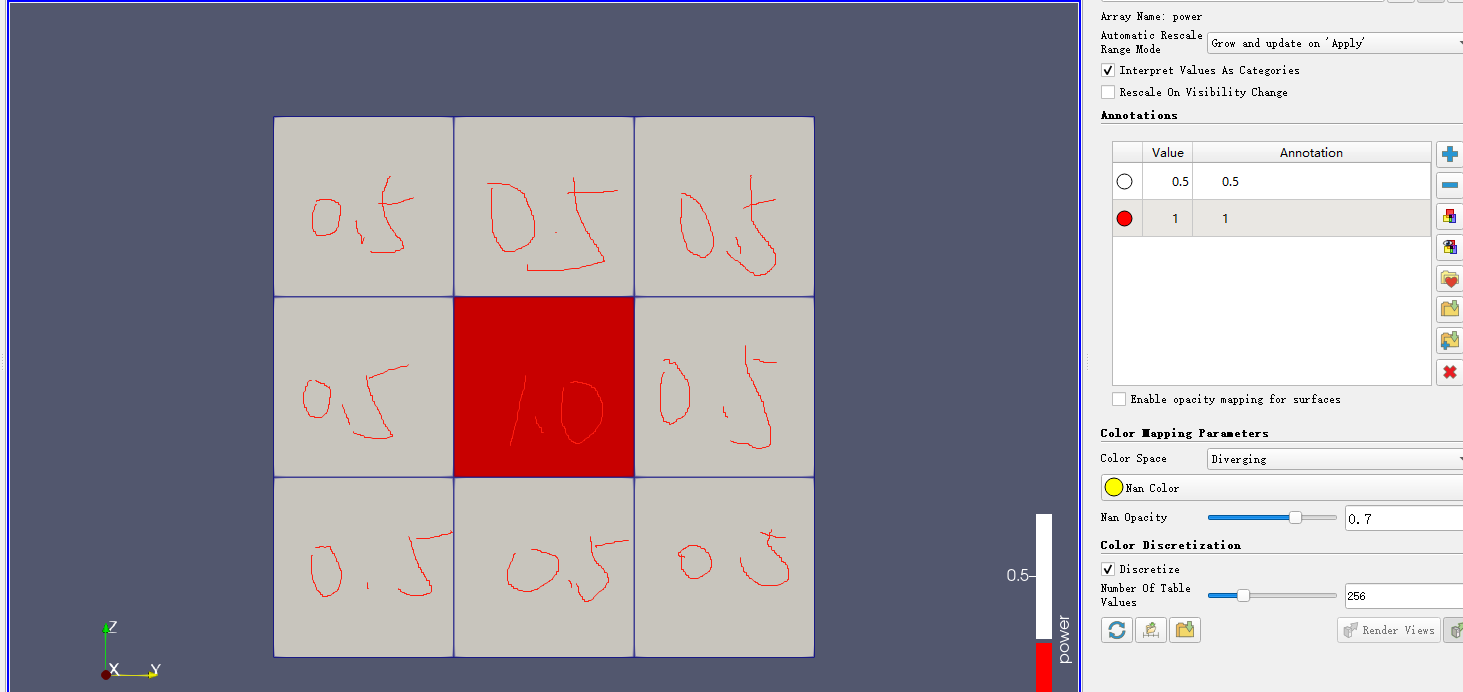
My figrue in paraview as follow:
You should change the array used for coloration. You need to have an array containing this info, and probably you should use Interpret Values as Categories in the color map editor.
Thanks for your reply, maybe I didn’t describe the problem clearly enough. my target is not render model by material array, is to display the material array in the grid.
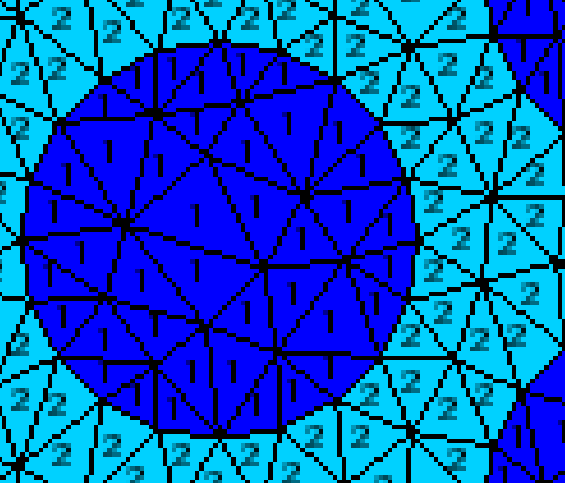
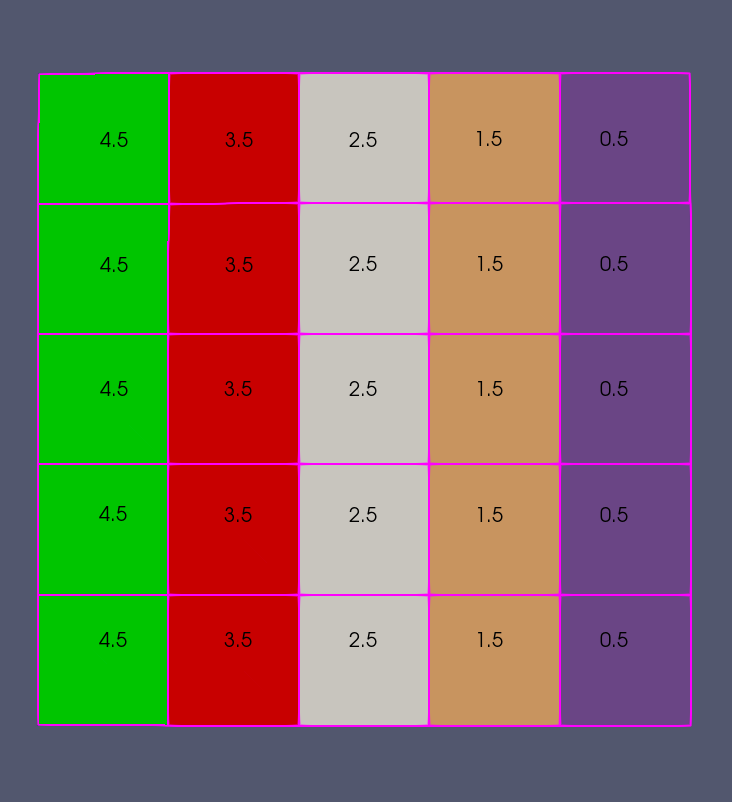
you can zoom in on the figure 2, and you will see the follow figure:
it dispaly the material array value in grids, i also want to display the material array values in grids by using paraview.
the Interpret values as Categories can render the model by material array, but can not display the material array values. another example as follow foigure:
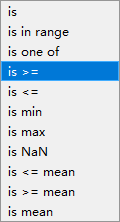
In the Find Data panel, after creating a selection, you can configure labels and edit their visual properties. Note that by default, not all elements are labelized: you should change the max in the settings.
I want to plot the top cells, but i use the function(as figure2) can not select the cells i want(cell number 1 3 5 7 9 11 13 15 17). Is there any way to select cells i want?