HeshamFS
June 23, 2021, 12:07pm
1
Dear community members.
I hope that I can find my answer here.
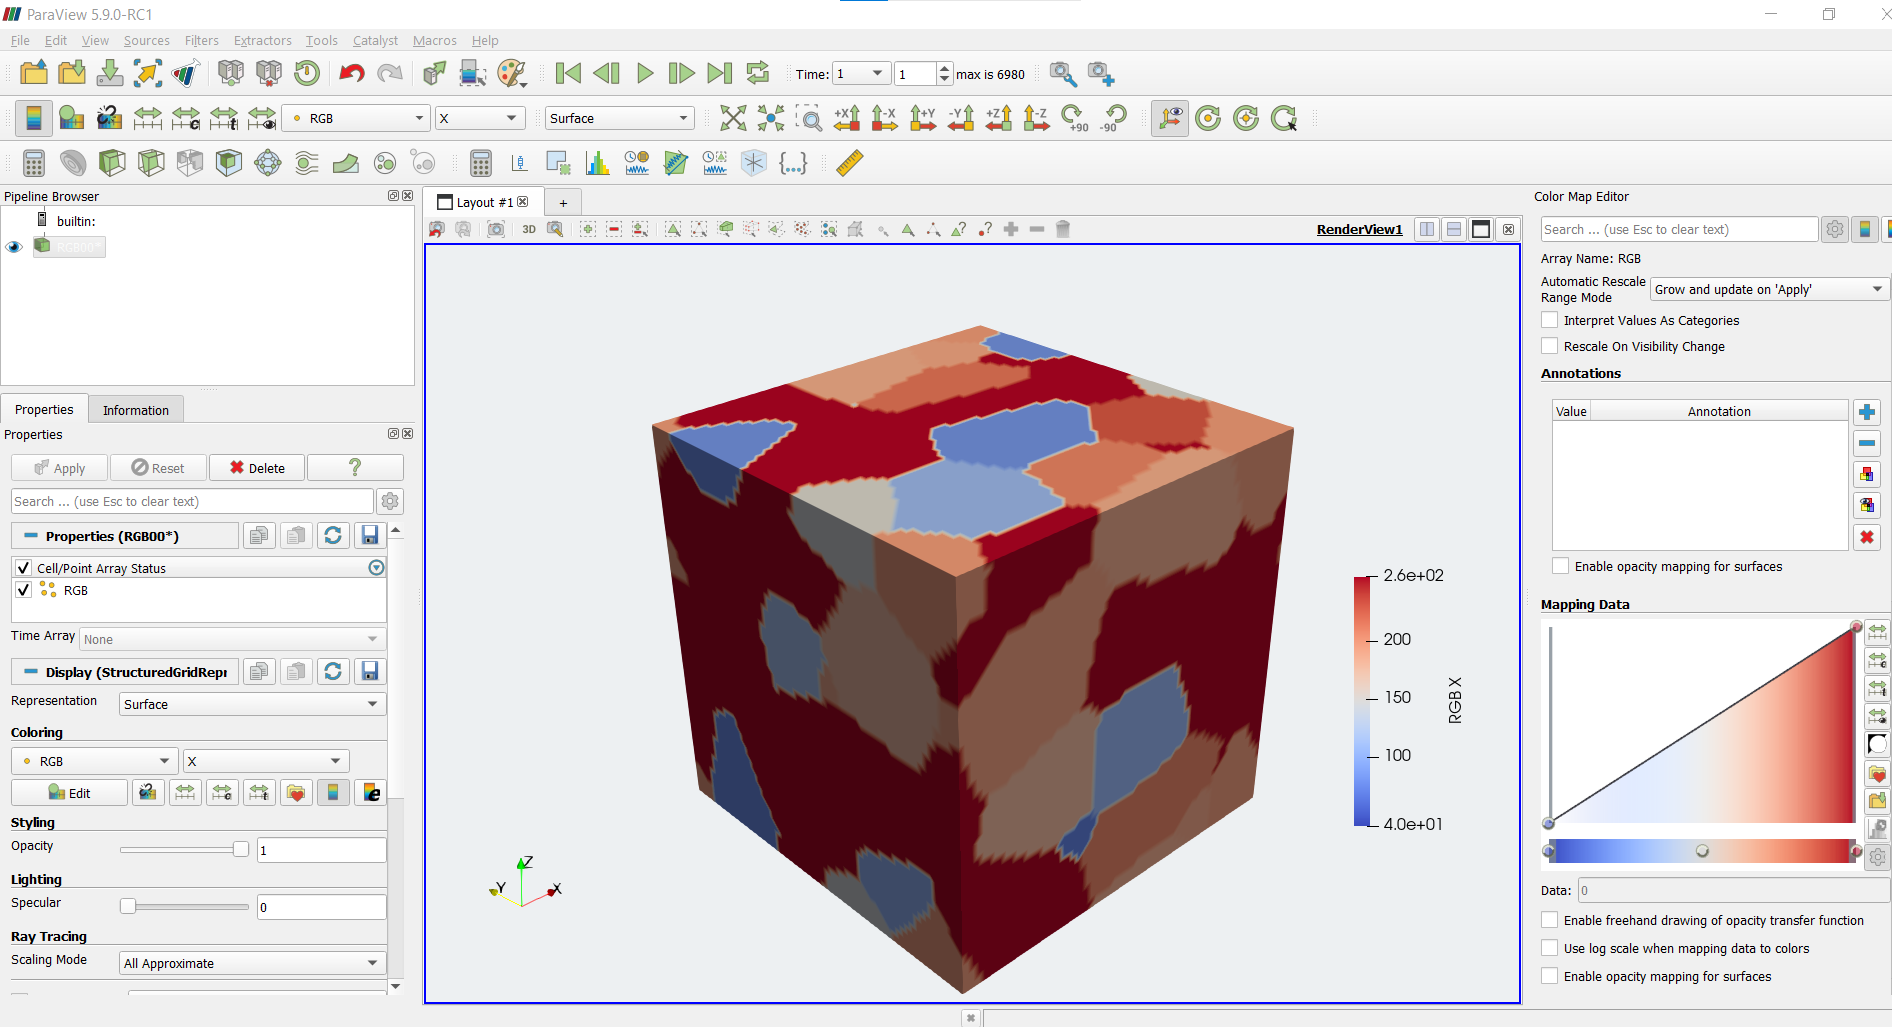
I created a “VTK” output which gives an RGB vector for each point on my microstructure. The RGB range is (0-255), not (0-1); however, I can normalize the vector as well.
My question is, How do we get the RGB colour in Paraview out of these vectors?
Kindly find my output.
Is it possible? Could you please advise me
Best regards,
mwestphal
June 23, 2021, 12:08pm
2
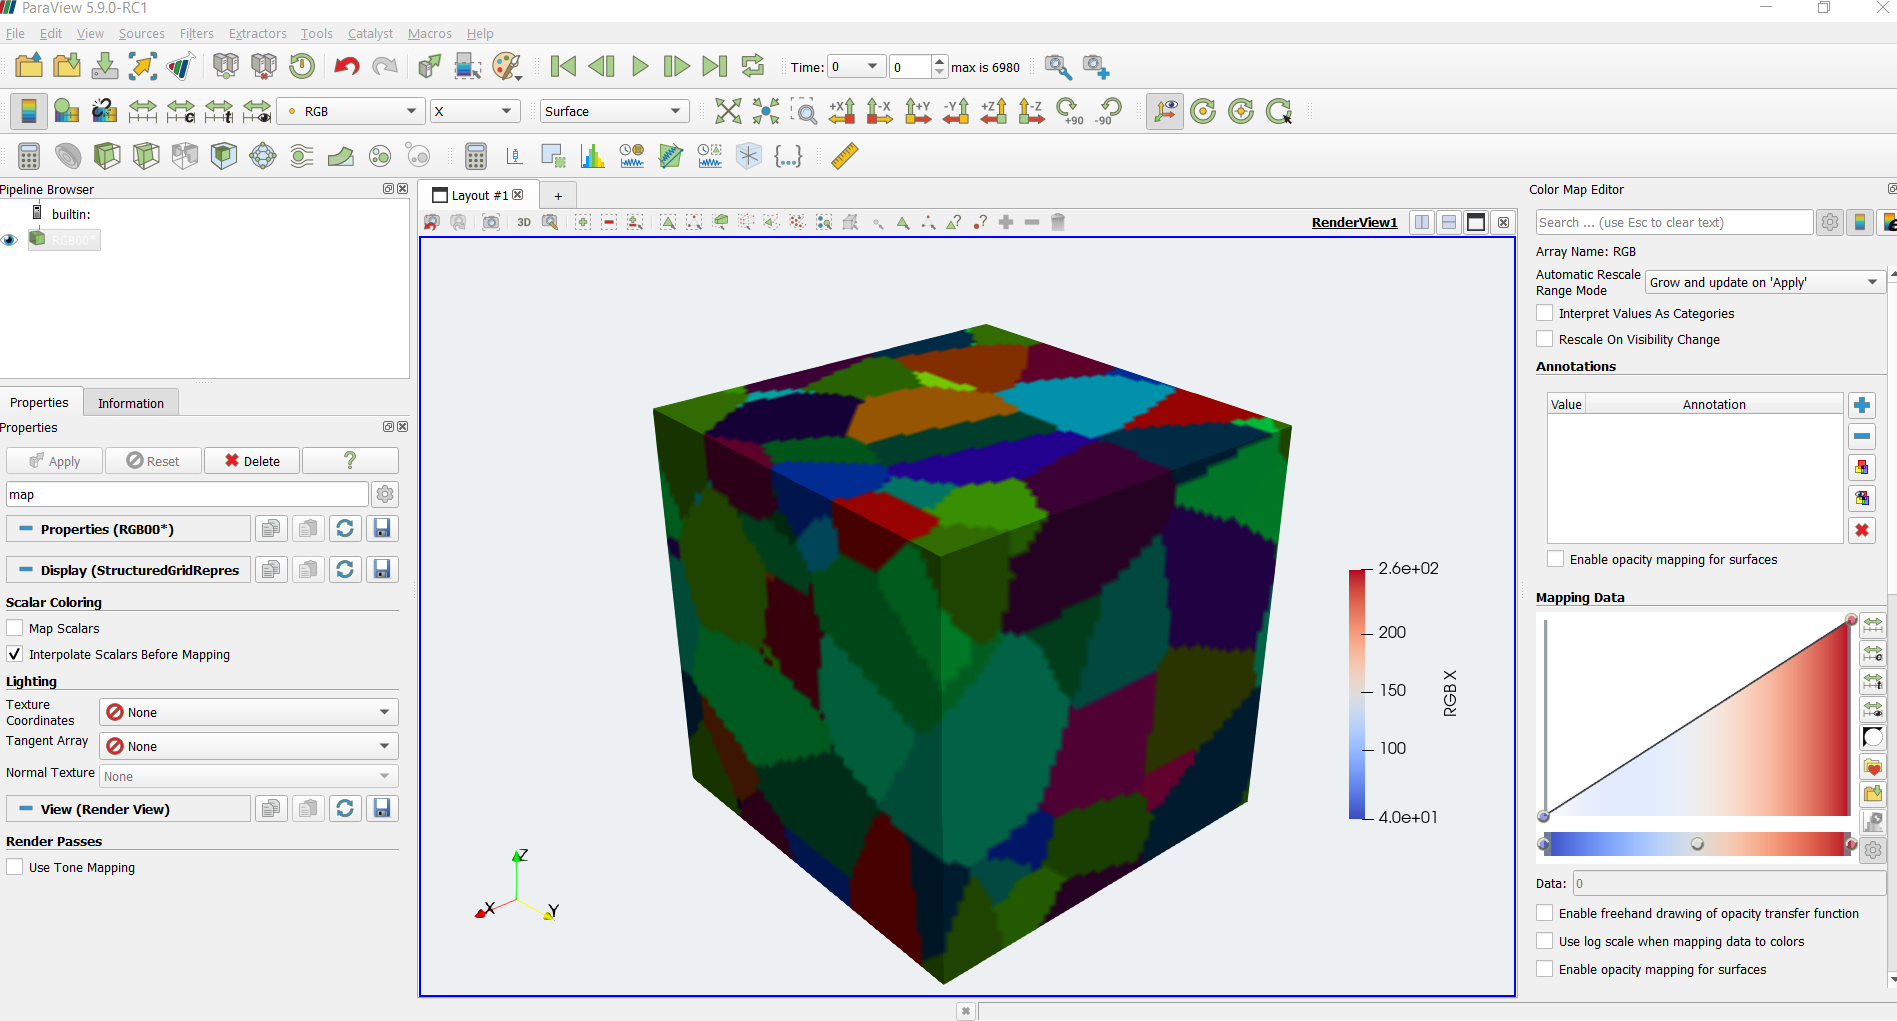
Uncheck “Map Scalars” in the advanced option of the representation in the properties panel.
HeshamFS
June 23, 2021, 12:11pm
3
Thank you, Mathieu, for the quick and helpful reply. I appreciate it.
I have another question, How can I get the colour legend accordingly?
Thank you,
mwestphal
June 23, 2021, 12:15pm
4
I’m afraid a color legend would not make any sense without using MapScalars. You should just hide it.
HeshamFS
June 23, 2021, 12:16pm
5
That is true, I will manually use a colour legend.
Thank you again, Mathieu!