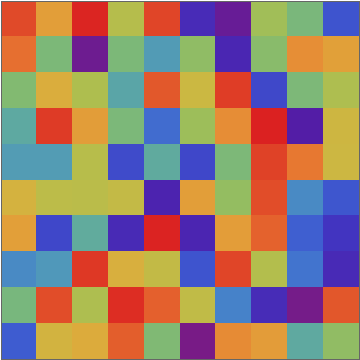
I would like visualize this dataset:
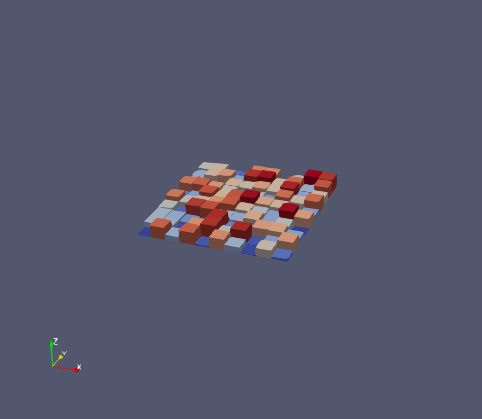
as an array of 3d blocks / cuboids, whose height scales with the value of the element. It should result in the following picture:
Is it possible to do this in ParaView?
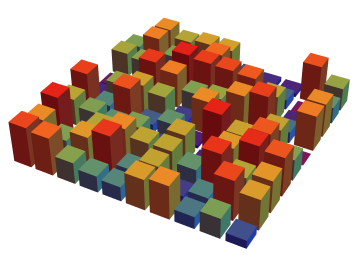
I tried using the filters Cell Data To Point Data + Warp By Scalar, but then I get a continuously deformed surface.
Attached is a text file with data: data.dat (1.9 KB)