This is an embarrassing question as I need help with remembering how I achieved this in the past. I did not use Paraview for 5 years and in that time I managed to forget my workflow. I am getting dizzy trying to remember it so I give up, for now, and am asking for help.
I want to remember how to recreate this visualisation:
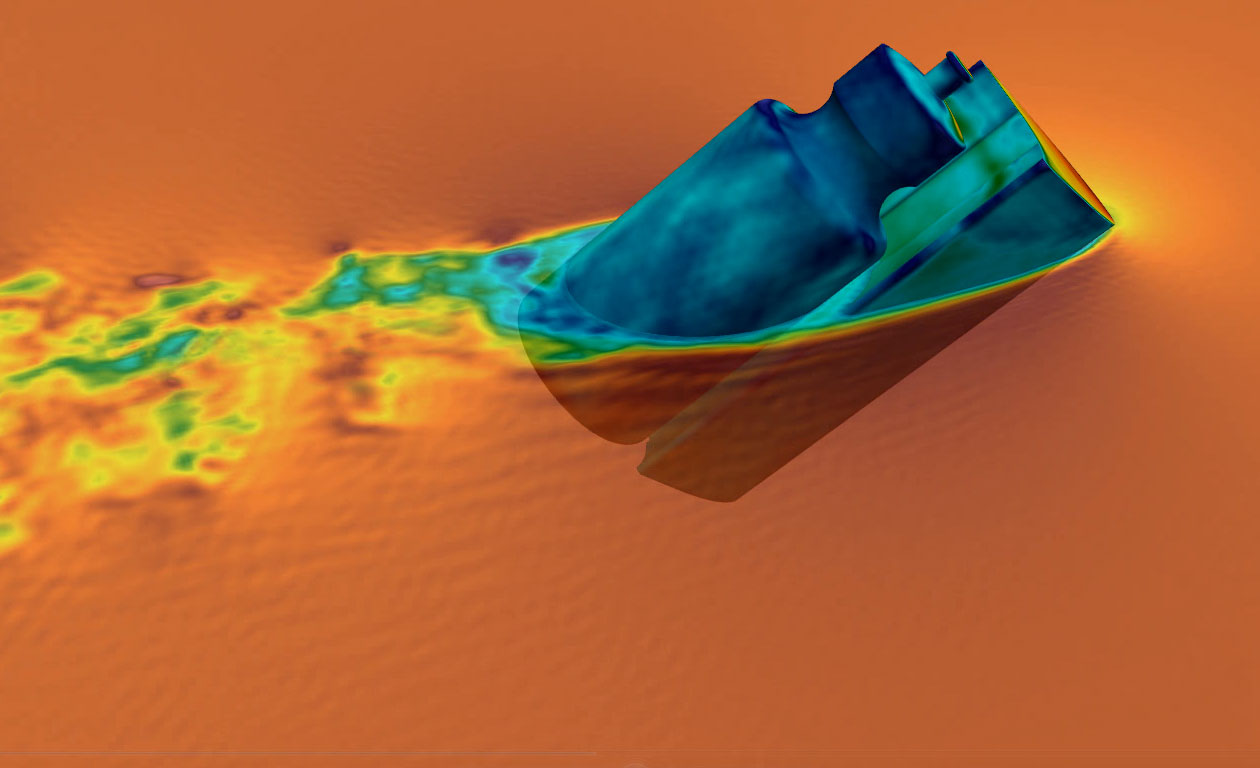
The input file is a large VTK domain. The object is inside the domain and I plotted surface pressure, and a y-normal slice on it/around it.
I know how to generate a slice, but for the life of me (I would literally die if this was a life or death situation) I cannot remember how I extracted the object of interest from the domain, and plotted surface pressure data on it.
Never mind. I figured it out. Our software (I really need to go through the code again, it is unreal how much I forgot over the years) creates a separate file with scalars on the surface of the object of interest. That file also needs to be imported and that is the file that shows the object in the example image. I will now “solve” this issue.
The second issue with the Windows version of Paraview being unable to process the same files without throwing up errors remains. Fortunately WSL2 is working far better than expected.