Improved Python Calculator expression editor

I’ve been working on improving the Python Calculator panel in ParaView and would love some early feedback before this lands.

What’s new:

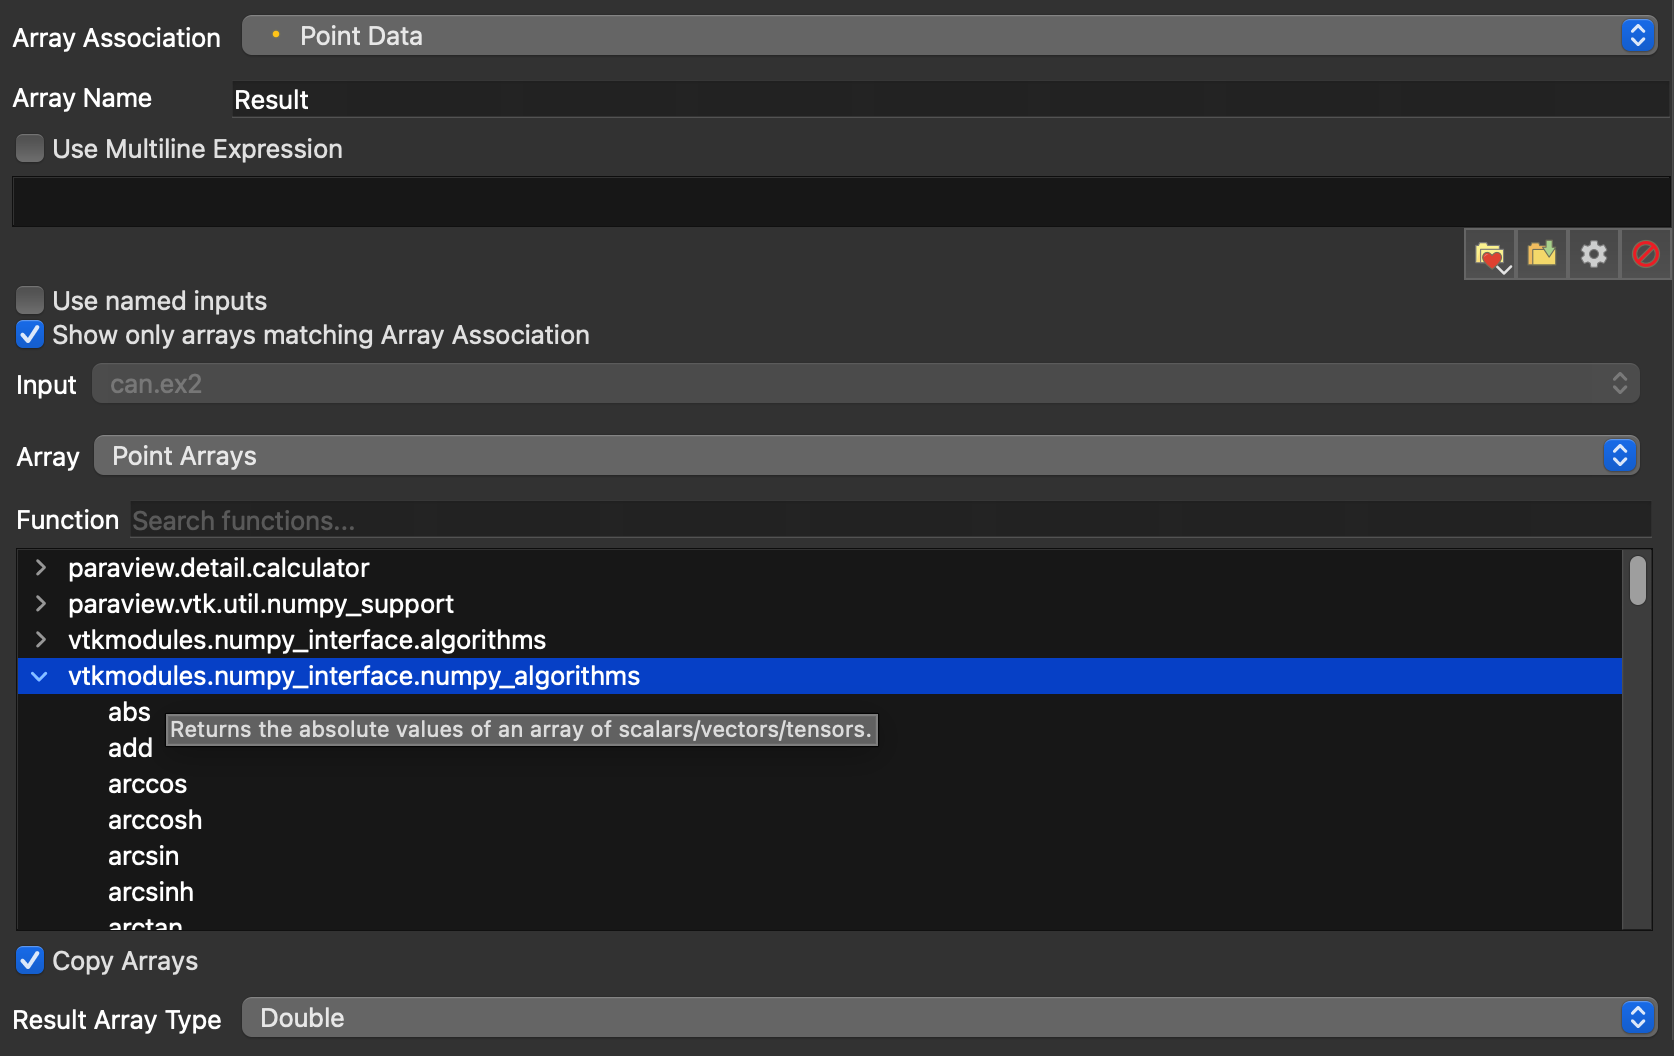
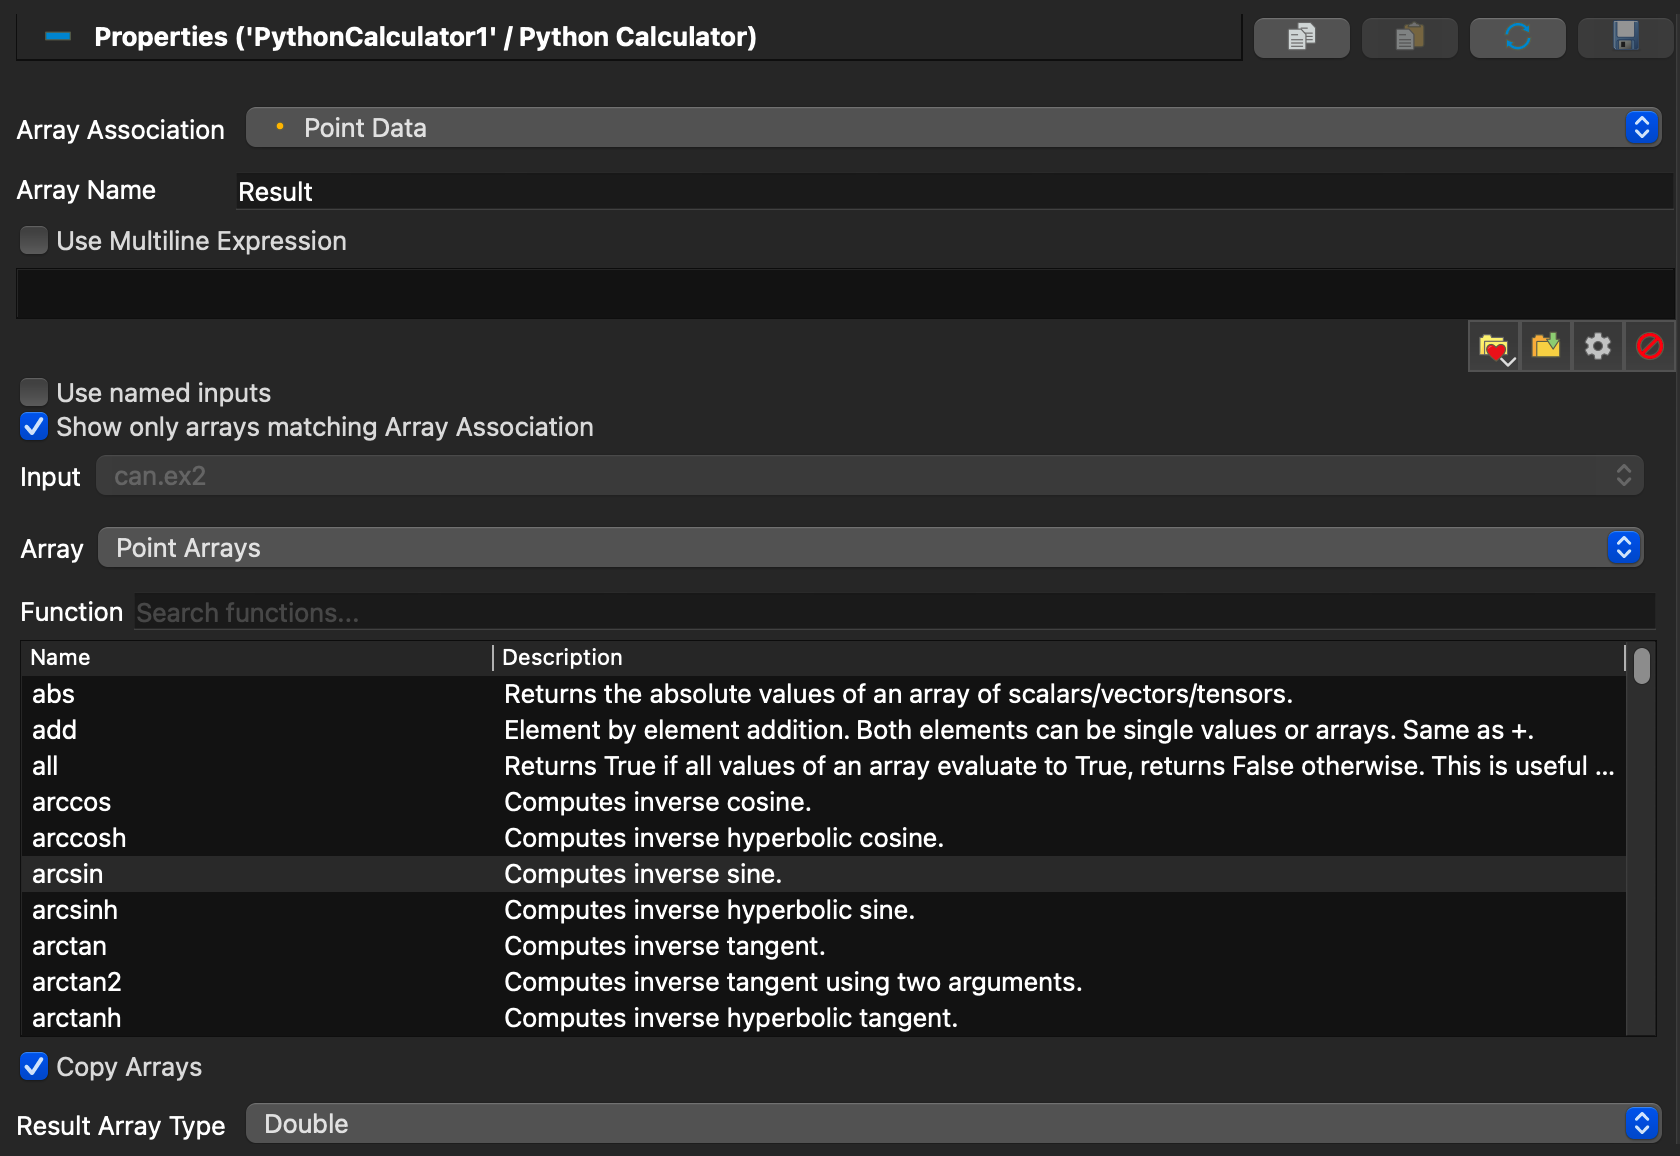
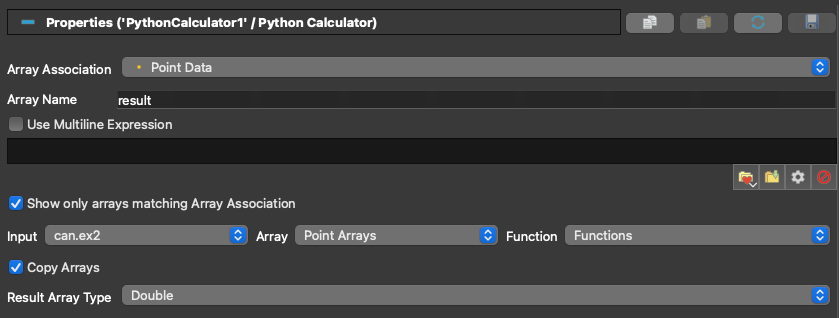
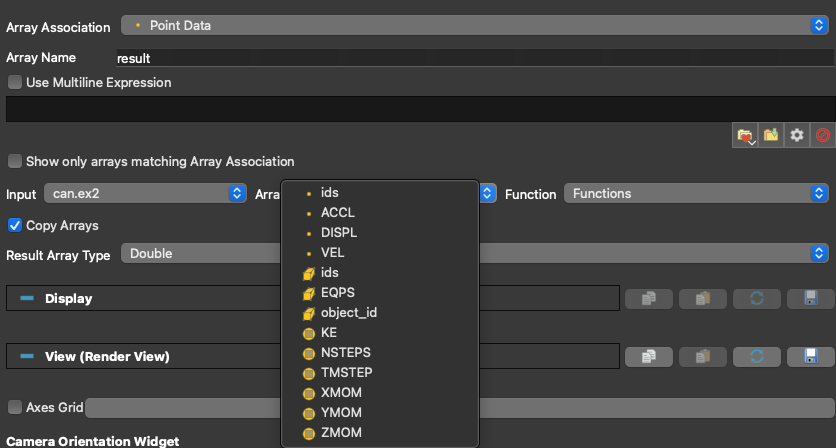
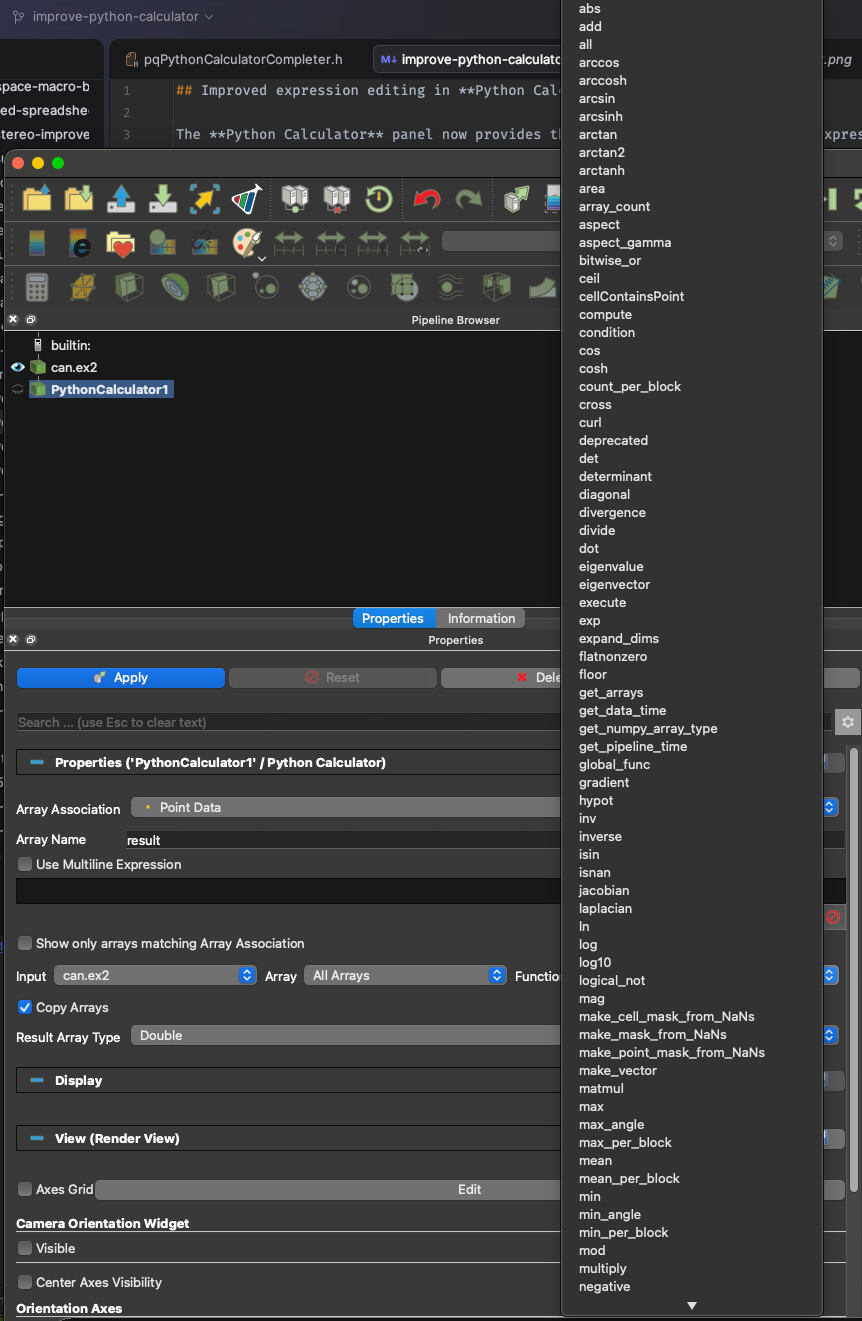
The panel now has three helper dropdowns alongside the expression editor:

  • Input: pick which connected dataset to browse. With multiple inputs, the generated expression uses numeric indexing (inputs[0], inputs[1], …) so expressions stay reusable across sessions regardless of dataset names.
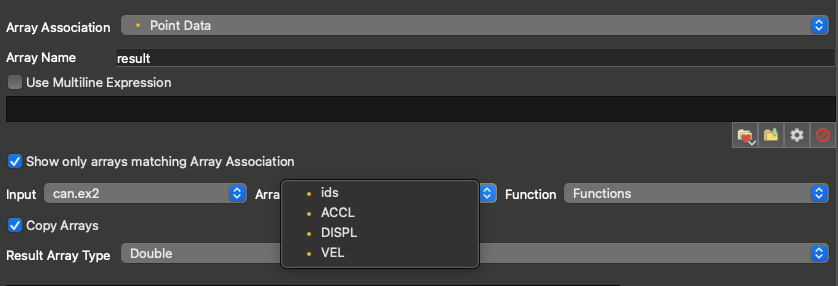
  • Array: browse arrays from the selected input, optionally filtered by the current Array Association. Clicking inserts the right accessor for you (e.g. inputs[0].PointData[“Velocity”], or just “Velocity” in single-input filtered mode).
  • Function: lists the Python functions available in the calculator’s namespace (numpy algorithms like gradient, divergence, laplacian, and others). Clicking inserts function() with the cursor between the parentheses.

The goal is to lower the barrier for users who don’t know the accessor syntax by heart, while staying out of the way of power users.

Things I’m specifically looking for feedback on

  • Is the numeric indexing (inputs[0]) the right call, or do you find named indexing (inputs[“MyDataset”]) more readable in practice?
  • Is the Function list useful as-is, or is it too noisy? What filtering would you want?
  • Any other workflows around the Python Calculator that feel unnecessarily painful today?

@wascott @mwestphal @cory.quammen @berkgeveci @EthanStam @nicolas.vuaille

  • It would be nice to have a function browser instead of just a combo-box. Do the functions have any documentation strings or other metadata associated with them (such as the number of input parameters, output value type)? Should operators (<, >, <=, >=, ==, !=) be included as functions?
  • Show a preview. One option would be to have a table showing a preview of a few input values and the corresponding output values. Another option: a lot of tools have the ability to click a checkbox to enable a “live” preview of the output.

That will be a very long list if this is exhaustive. A handpicked one seems better to me.

feel unnecessarily painful today?

Default output array name should be the same as calculator. Result.

Other ideas

Thnking about it, generifying the calculator widget to be usable with the python calculator would be a nice way to go.

Oh, that would be nice. Something like the Filter search dialog, but for functions.

numpy.<func>.__doc__ gets you the doc string that could be displayed in the dialog, e.g., print(numpy.sin.__doc__) produces

sin(x, /, out=None, *, where=True, casting='same_kind', order='K', dtype=None, subok=True[, signature, extobj])

Trigonometric sine, element-wise.

Parameters
----------
x : array_like
    Angle, in radians (:math:`2 \pi` rad equals 360 degrees).
out : ndarray, None, or tuple of ndarray and None, optional
    A location into which the result is stored. If provided, it must have
    a shape that the inputs broadcast to. If not provided or None,
    a freshly-allocated array is returned. A tuple (possible only as a
    keyword argument) must have length equal to the number of outputs.
where : array_like, optional
    This condition is broadcast over the input. At locations where the
    condition is True, the `out` array will be set to the ufunc result.
    Elsewhere, the `out` array will retain its original value.
    Note that if an uninitialized `out` array is created via the default
    ``out=None``, locations within it where the condition is False will
    remain uninitialized.
**kwargs
    For other keyword-only arguments, see the
    :ref:`ufunc docs <ufuncs.kwargs>`.

Returns
-------
y : array_like
    The sine of each element of x.
    This is a scalar if `x` is a scalar.

See Also
--------
arcsin, sinh, cos

Notes
-----
The sine is one of the fundamental functions of trigonometry (the
mathematical study of triangles).  Consider a circle of radius 1
centered on the origin.  A ray comes in from the :math:`+x` axis, makes
an angle at the origin (measured counter-clockwise from that axis), and
departs from the origin.  The :math:`y` coordinate of the outgoing
ray's intersection with the unit circle is the sine of that angle.  It
ranges from -1 for :math:`x=3\pi / 2` to +1 for :math:`\pi / 2.`  The
function has zeroes where the angle is a multiple of :math:`\pi`.
Sines of angles between :math:`\pi` and :math:`2\pi` are negative.
The numerous properties of the sine and related functions are included
in any standard trigonometry text.

Examples
--------
Print sine of one angle:

>>> np.sin(np.pi/2.)
1.0

Print sines of an array of angles given in degrees:

>>> np.sin(np.array((0., 30., 45., 60., 90.)) * np.pi / 180. )
array([ 0.        ,  0.5       ,  0.70710678,  0.8660254 ,  1.        ])

Plot the sine function:

>>> import matplotlib.pylab as plt
>>> x = np.linspace(-np.pi, np.pi, 201)
>>> plt.plot(x, np.sin(x))
>>> plt.xlabel('Angle [rad]')
>>> plt.ylabel('sin(x)')
>>> plt.axis('tight')
>>> plt.show()

Aligning these horizontally will require the panel to be very wide - I suggest arranging them vertically.

Let’s vote:

  • Use numeric indexes
  • Use names
0 voters
  • Too noisy: prune it.
  • Too noisy: turn it into a hierarchy.
  • Not noisy: leave it.
0 voters

Both should be supported anyway.

I believe the default should be indices, so that expressions are reusable among different datasets. i had names in the past, but expression reusability won me over, named version could for sure be an option.

I think using numeric indices is optimizing for the corner case rather than common case. As long as the calculator can recover from non-existent inputs, using names makes reading the expression much easier.

It does, but names are mostly useful when you have many inputs, and in most cases you have 1 input so you are super verbose for no real reason.

I took into consideration your feedback and now the calculator looks like

The default array name is Result now.

I added an option Use named inputs (off by default, until we decide otherwise)

Input combo box is off when there is only 1 input

There is now a function browser that groups functions per module (maybe that’s an overkill) and you can search by function name to look for what you want, and when you hover you get the documentation of the function (if it’s not great, then potentially we can improve them at a future MR because it will probably involve VTK too).Tto select a function you have to double click.

Also input, Array and function are grouped vertically now.

That’s pretty nice!

I agree that the grouping by module is overkill and exposes implementation details that I don’t think matter in the Python Calculator filter context.

I also added an one line description to avoid having to hover. But still hovering gives you the full doc string.

That’s a nice addition, but the panel has to be very wide to see most of the descriptions. Maybe instead of a second column, a function description area below the function list where long text is word wrapped as needed?

Why have an exact label for function description when hover exists? hover does not require a click, which is faster than clicking a function and populating the description field, right?

Usually the first line gives a good enough idea. and hovering gives the full picture.

Yeah, that’s true. I’m happy with the description in the tooltip.

I’m leery about the wide description column in the table that is going to require users to widen the panel several times its original width to see the full description. How about adding a horizontal scroll bar to the table and constraining the overall table width?