Hi, thanks for your help. I finaly found this “Cache Geometry for Animation” setting even in the v5.7 version which works now fine.
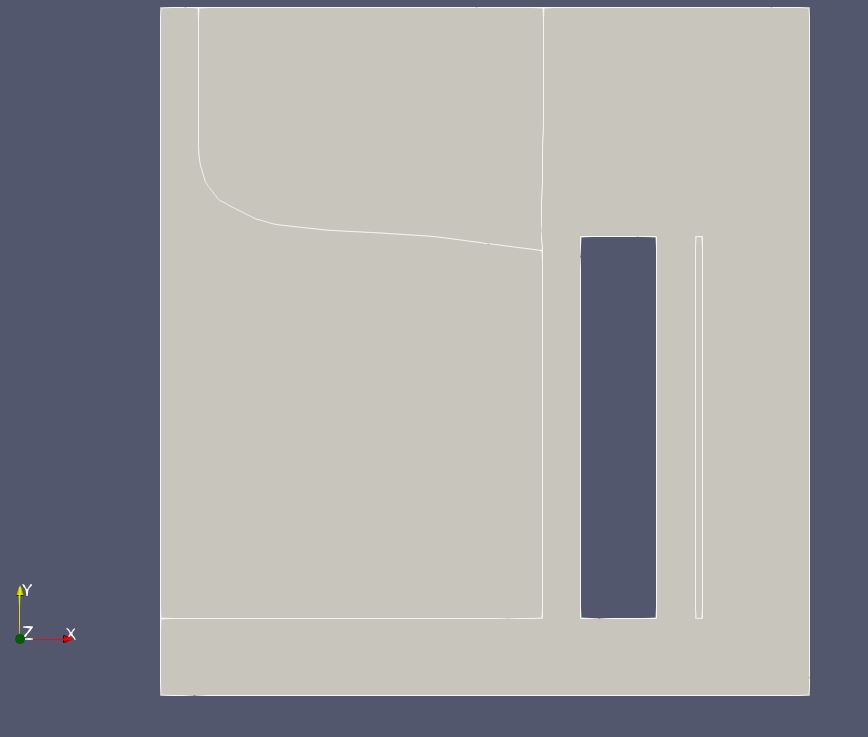
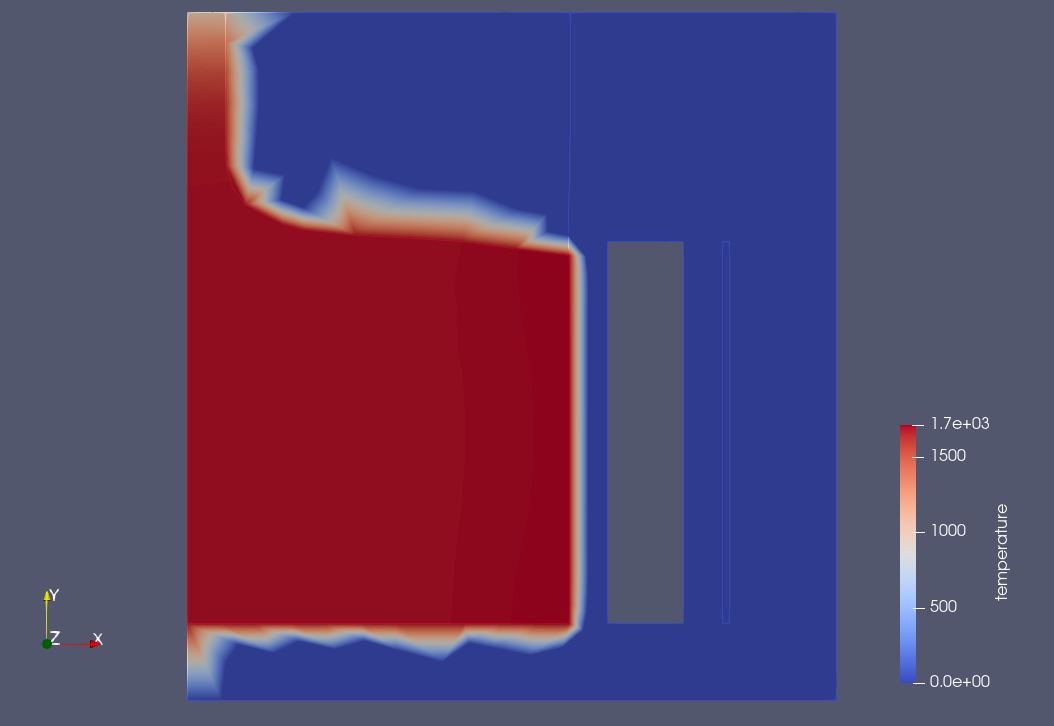
I have another question: I am working on an Elmer multiphysics Crystal Growth model in an electromagnetic cold crucible. Here attached is a screenshot of the geometry which shows a left body beeing the Silicon liquid out of which a solid crystal is pulled out on the top. This Silicon body is surrounded by a cold crucible sector and a one layer inductor (the vertical rectangles on the right). The edges of the bodies (pale white lines) are not very visible. Moreover when plotting the results like for instance the temperature (see the 2nd attached screenshot), these bodies edges are barely visible.
So is there a way to increase the visibility of the bodies edges (contrast, thickness of the lines, etc…)?
Thanks in advance for any help about that.
Hi,
I just want to add another thing my the former message:
As seen on the former temperature plot, the temperature (mainly red colour) is plotted in the Silicon body where the heat transfer physic is activated, but it is also plotted a little outside of the Silicon body, meaning in the surrounding air domain where the heat transfer physic is not acticated. This is uncorrect since, as the heat transfer physic is not activated in the surrounding air domain, the temperature plot should be zero (blue colour) in this air domain.
Thanks for any help for this.
Hi @Roland01. Since the topic changed from the original, I created a new post with your last two message.
Under the “Display” section of the Properties panel, find the Line Width property and increase that. It is an advanced property, so you can find it either by clicking on the gear icon to the right of the search text field towards the top, or start typing “Line” in the search field and you should find it.
This is a result of data interpolation across the mesh cells just outside the silicon body. My guess is the high values are on cell edges on the edges of the body and cells outside the body are fairly large, producing the effect you see here.
Hi,
1/ Concerning the “Line Width” property I tried it by increasing the width, but then it increases all the lines like for instance also the edge lines of the mesh. What I would like to do is only to increase the thickness of the edge (the boundary lines) of the domains, and also to change the colour and the contrast. Do you think that this is possible?
2/ Concerning the temperature which sould be plotted only in the Silicon activated body, could it be possible to do this by using a “Threeshold filter” on the Geometry Ids?
If you can extract those edges, which you may be able to do with the Feature Edges filter, then you can change the line size and color independently. There is no such thing as a contrast property, but your choice of color will control the contrast your lines have with the background.
I don’t have your data, but if Geometry Ids is an array that differentiates between the body and background, then yes, Threshold should be able to extract the body geometry.
Hi,
Ok I will try the Feature Edges filter for the edges.
Concerning the temperature plot only in the activated Silicon body, I send you here attached a vtu file with all the data (variables) including the Geometry Ids.
It would be very nice if you could help me to plot the temperature (in colour) and the velocity streamlines only in the activated Silicon body (I think it is identified as the body n°1 in the Geometry Ids).
Thanks in advance
case_t0010.vtu (842.3 KB)
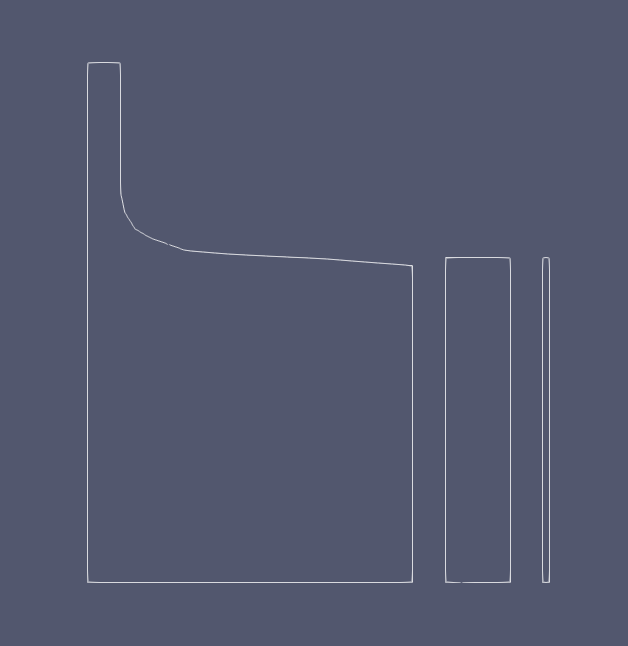
Thanks for attaching the data. Feature Edges won’t help here - I see that the boundaries of the body are already line segments. You can extract only the line segments into a separate dataset using the Extract Cells By Type filter and selecting the cell type to “Line” from the list.
I don’t see any kind of ID array saying which cells belong to the boundary of the domain, so you will have to use ParaView’s selection tools to isolate these lines. It’s fiddly work, but it can be done. You can add to and subtract from selections until you get something like this:
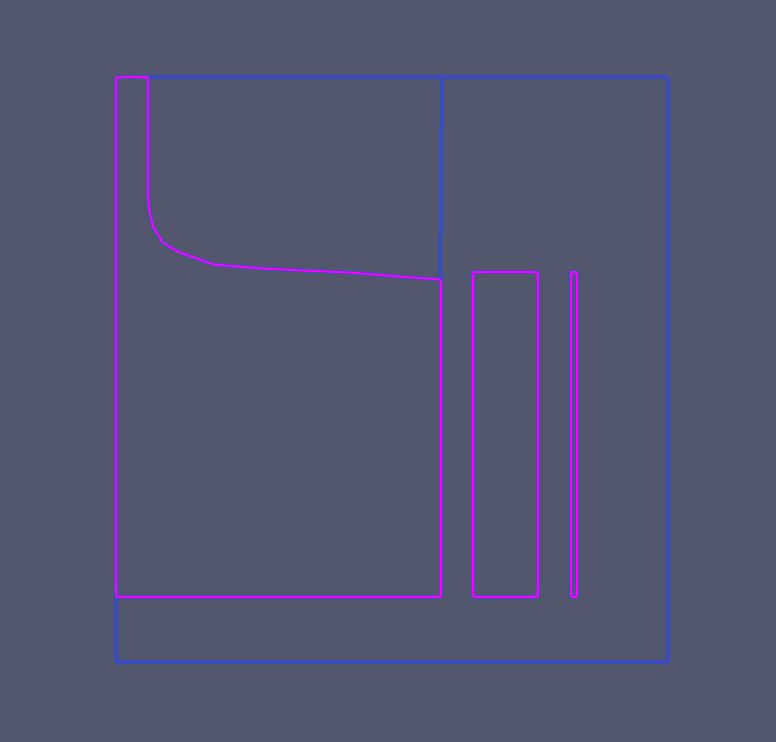
Once you have that, use Extract Selection to get what I am assuming are the domain boundaries.
Then you can set the Line Thickness separately for the ExtractSelection1 object in the pipeline.
I don’t see any array that is obviously one that can differentiate between body and background. You can use selection here for the surface cells to extract those you want to show.
Hope that helps!
Hi,
Yes thanks a lot for your help about the use of the Threeshold filter which works now well as showed in the attached plot.
I have another question:
When using the “Integrate variables” filter how is it possible to integrate a given variable only in one body, for instance the Joule Heat dissipated only in the Silicon body (I think it is the body n°1 in the Geometry Ids).
I join also a vtu file so that you can access the data.
Thanks in advance
Crystal_Growth_in_Cold_Crucible_200s.JPG.url (276 Bytes)
case_t0009.vtu (842.3 KB)
I still don’t see anything that looks like Geometry Ids in the dataset, so I can’t figure out how to threshold the Silicon body in the dataset you have provided. But no matter.
As long as you can Threshold the object of interested, simply attach the “Integrate Variables” filter to the Threshold filter in your pipeline and that will limit calculation to the thresholded results.
Thanks for your answer.
Sorry but there must have been something missing in the former file I sent you since there was no GeometryIds data as you say it.
I send you here attached another file with the GeometryIds included.
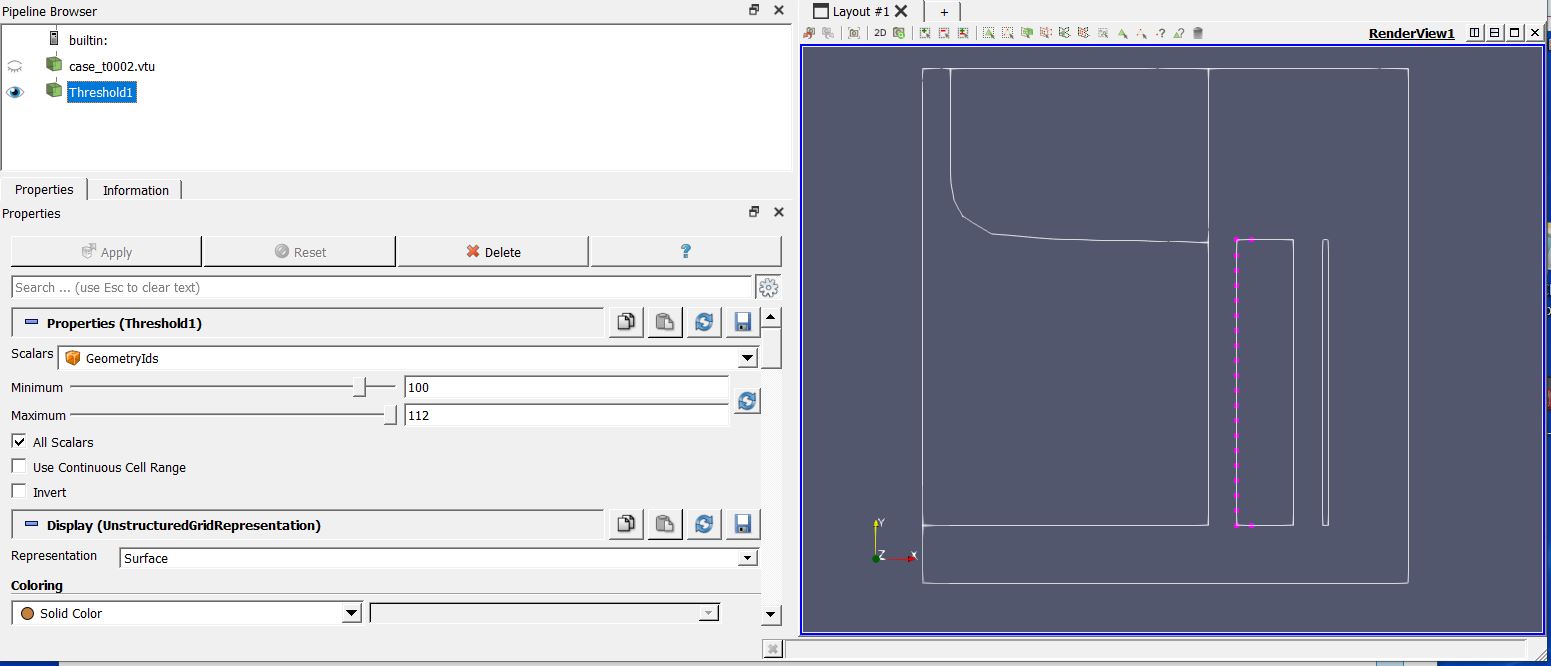
I also send you a screen copy with the GeometryIds filter selected on the edges only, meaning threeshold set to 100 to 112.
Then I selected the points (blue points) of the left vertical boundary of the cold crucible (the 4 edges of this cold crucibles correspond to GeometryIds=109).
I would like to:
1/ Plot a variable (say for example the Joule heating variable) along the left vertical edge of the cold crucible, meaning the selected blue points on the screen shot.
2/ Integrate this same variable (Joule heating) along this same edge.
Could you please explain how this could be done?
Best regards
case_t0002.vtu (807.0 KB)
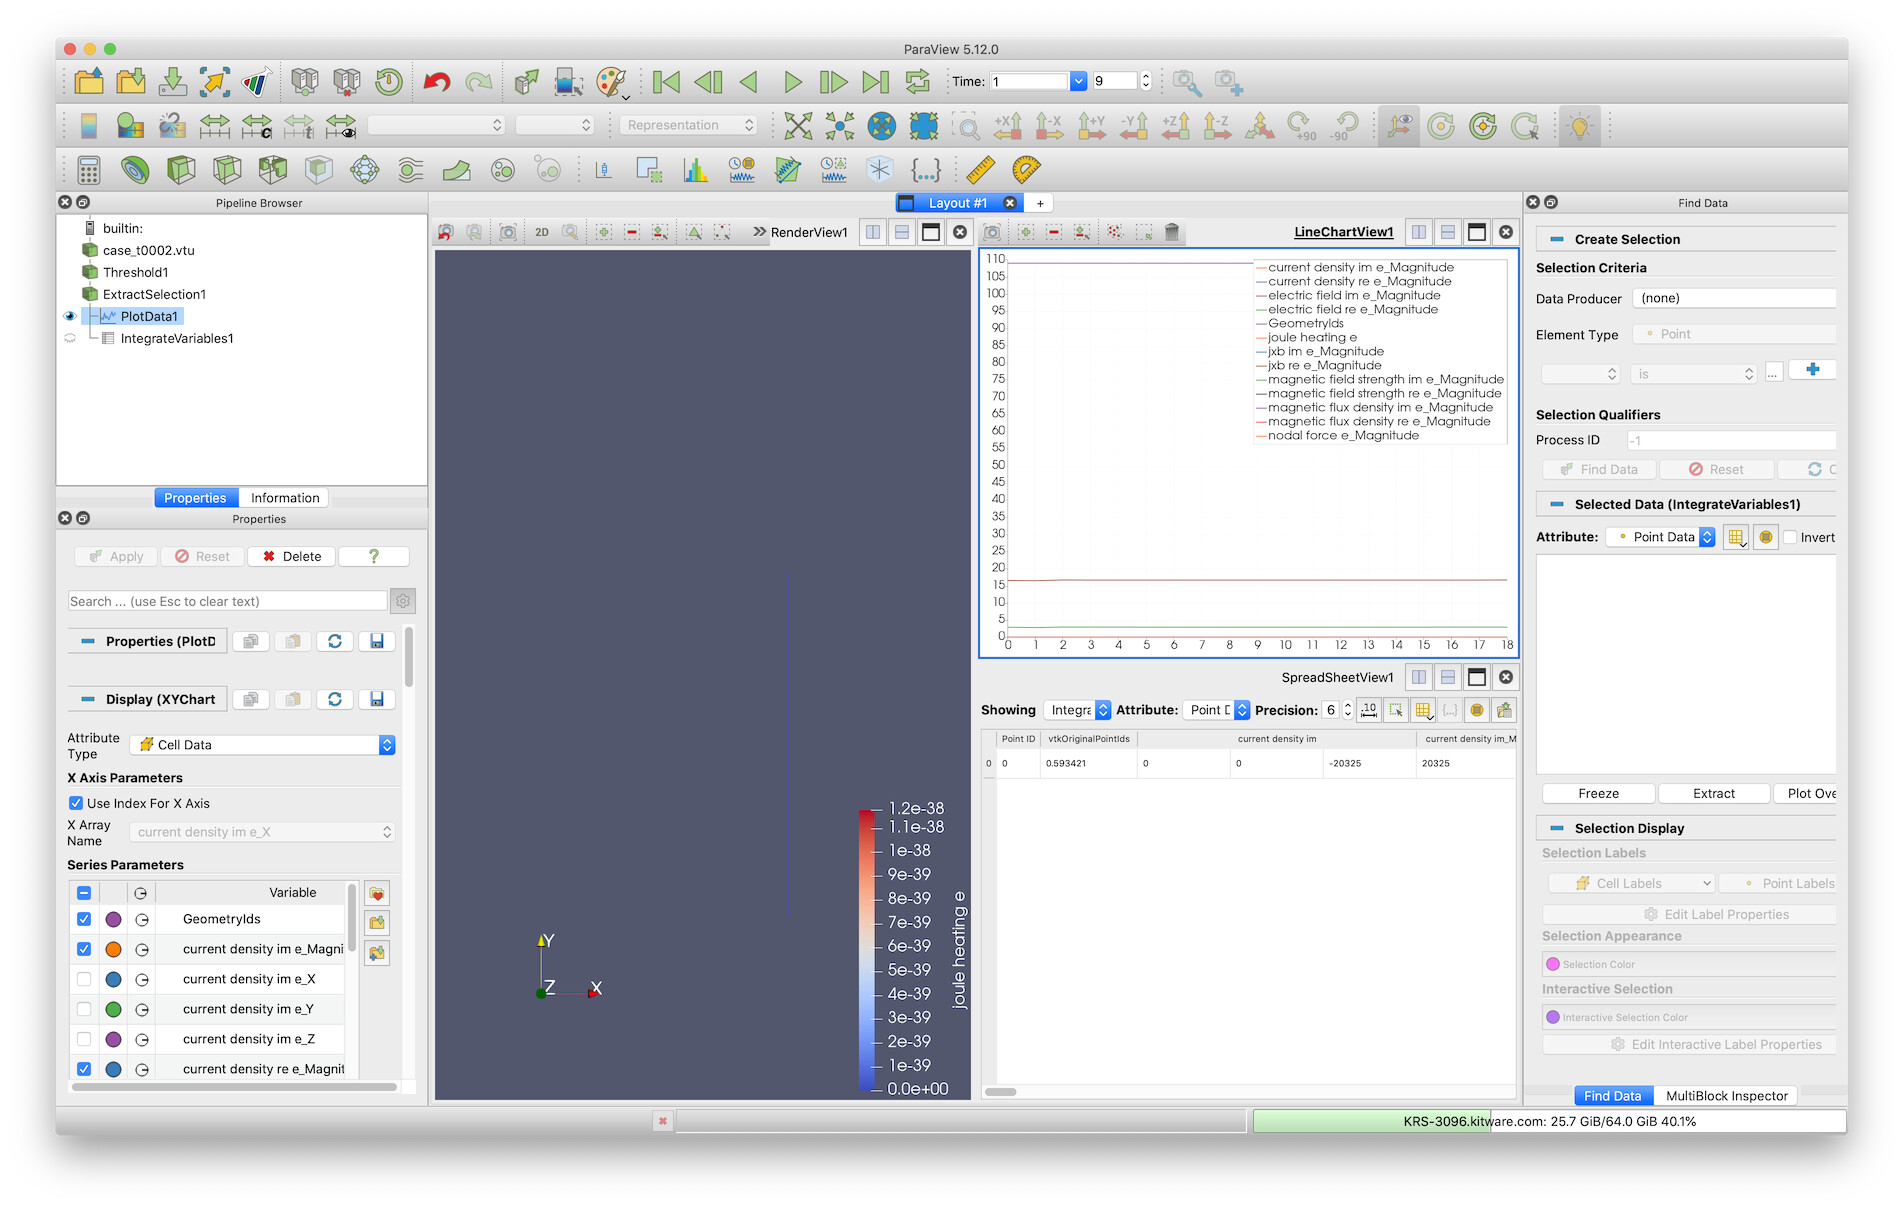
After you have made your selection, use the Extract Selection filter to get only the edge you have selected. Fortunately, the points in this line are ordered from bottom to top, so you can apply a Plot Data filter, change the Attribute Type property to “Cell Data”, and you’ll be able to see all the cell data fields (including “joule heating e”) plotted.
Simply add an Integrate Variables filter to the Extract Selection filter you added above.
Thank you for these help elements.
I have another question concerning this matter of using the GeometryIds threeshold filter for isolating the bodies and boundaries in a 2D model vtu result file. This is done by selecting either 0-100 for the bodies, or 100-200 for the boundaries and is ok.
Now when we have a 3D model like the attached simple “3D heated box” model vtu result file , my question is:
- is it possible, still with the GeometryIds threeshold filter to isolate not only the bodies (meaning the volumes) and boundaries (meaning the surfaces), but also the edges ? Meaning is there a GeometyIds threeshold value range for selecting the edges (in order for instance to plot or integrate a variable along this edge)?
box_t0001.vtu (56.0 KB)
Thank you in advance for your help.
Looking at your data, there do not seem to be any line elements that might correspond to an edge. So Threshold won’t extract these because they do not exist.
If you have a specific workflow you are unsure of how to achieve where edges are extracted, please open a new topic and walk us through what you are aiming to do.
Hi,
When you take a cube for instance:
- there is one body which is isolated with a GeometryIds threshold with value 1
- there are 6 boundary surfaces which can be isolated with a GeometryIds threshold of values 100,101,102,103,104,105.
This is ok.
-then there are 12 edges: my question is: with which GeometryIds threshold values can these 12 edges be isolated? Is there perhaps another way for isolating these 12 edges in the graphic window?
Thanks in advance for you help.
Your dataset contains tetrahedron and triangle cells. There are no line segment cells, so there is no data associated with line segments, e.g., a GeometryIds array, that would let you threshold those edges.
Instead, you would have to extract first the set of line segments that form the boundary of a face, for instance, by using the Feature Edges filter to get you the edges on the outer perimeter of the face. Note that Feature Edges requires a polygonal input dataset, so you will need to add a Extract Surface filter to your pipeline so that it looks like
Threshold → Extract Surface → Feature Edges
After that, if you want to select from the line segments, you’ll need to use ParaView’s cell selection tools to do that.