Hello everyone,
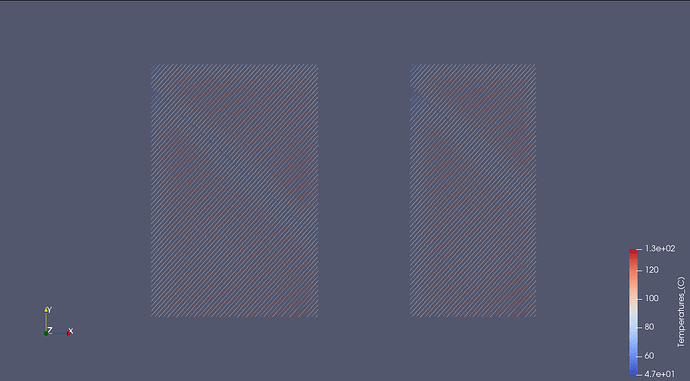
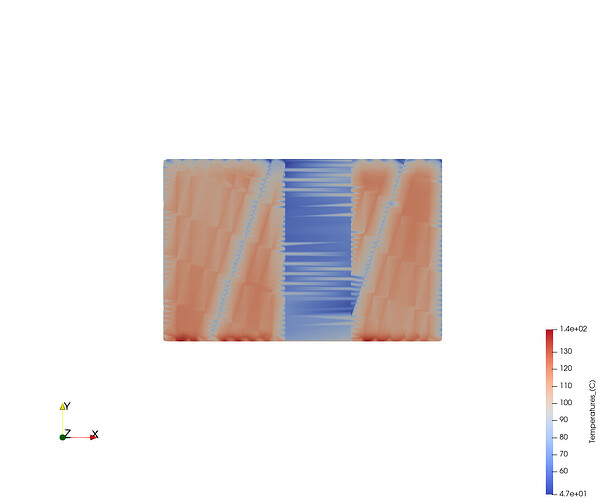
I am brand new to ParaView and I have data from Ansys Additive in .vtk format that contains temperature values for a slice of a 3D object. I would like to be able to visualize this information and be able to use it for publication, however, in it’s current form, the aesthetic of the image is not great:
Even if I increase the line width, the resulting image is still not suitable, and it is just best to leave it as is with the default settings. My question is, is there anyway to interpolate between the values in 2D to obtain a surface given the data shown, similar to what a 2D surface plot would look like in Matlab? I tried to look at some of the filters and previous posts in the forum, but I haven’t come across anything that helps. Thank you in advance for your help.

