What I want to do:
I want to display a scalar field over the cells of a structured grid, by using the volume representation (so I may use the Multi Components Mapping) and at the same time show the displacements of the nodes (by using the Warp by vector filter).
What happens:
I use the following VTK-file as data input:
then, when importing to Paraview, I use the Warp by vector filter on vect3 and then display scalars with a volume representation.
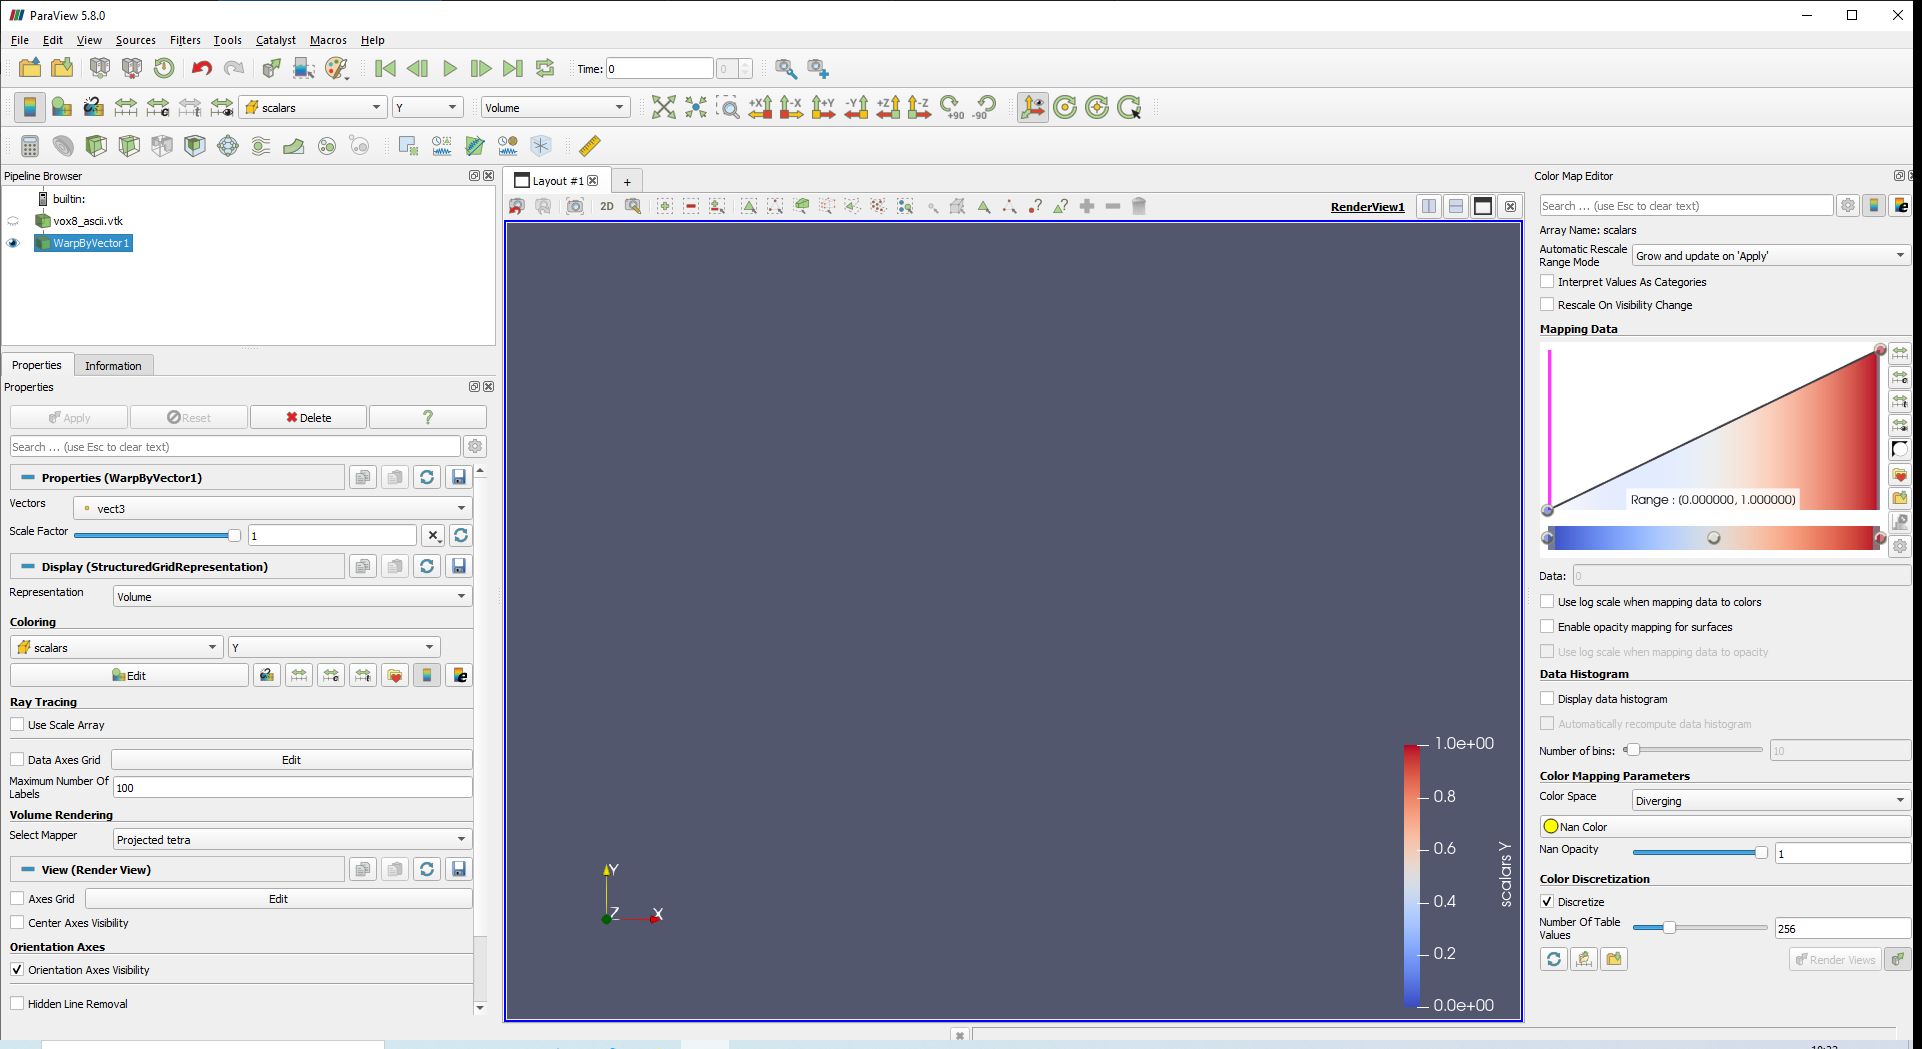
The problem is that the volume is now invisible, and it doesn’t matter if I check the Multi components mapping checkbox or not.
Am I doing something wrong maybe? I have tried to simplify the example as much as possible, and hope it should be obvious what I want to achieve.
EDIT: Here’s a picture of how it looks like when the volumes are invisible
Woops, I didn’t even reflect over that fact, thank you for pointing that out!
The reason I want to use volume rendering is as I mentioned before: I want to use Multi Component Mapping on my two component scalar field. And this would include visualising 2D geometries this way.
If I extend the data to 3D, 1 element thick in the z-dimension, it works fine
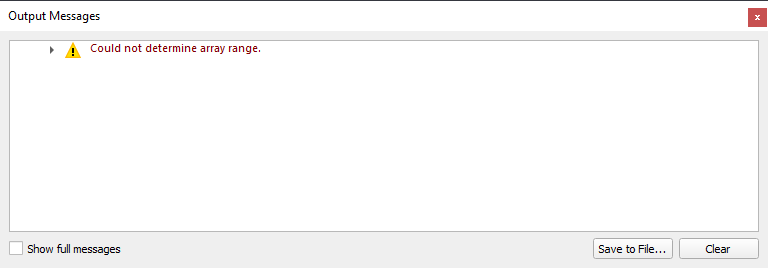
However, I encounter another small issue this time. Using this file:
I guess there is some formatting error in the VTK file that is not breaking, but still not 100% correct. I have however a hard time finding a good VTK reference to guide me. Do you know what could be the problem here?