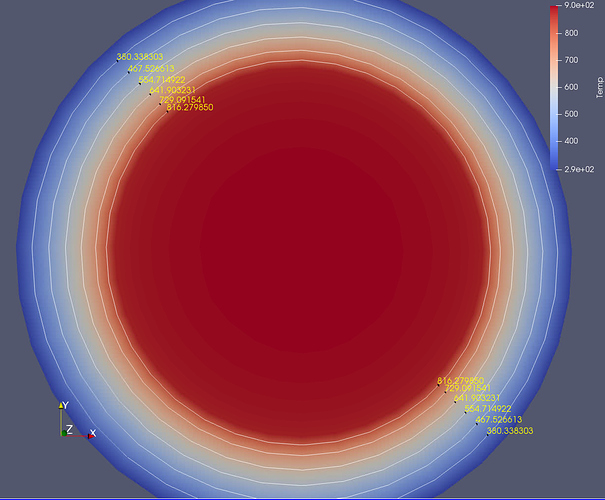
Everyone has access to disk_out_ref.exo. It comes with ParaView by default. File/ Open then, in the upper left corner, is Examples.
OK, after staring at it long enough, I did figure out what Kyoshimi is saying. Here are the steps to replicate what is above: Not necessarily easy or intuitive. Further, you can’t turn off the selection - but you can change the color (say to black) in the Color Palette editor.
- ParaView 5.6.0, Linux, builtin server (will work remote server)
- File/ Open/ Examples/ disk_out_ref.exo. All variables on. Apply.
Now, we want to acquire a 2d surface. We will “paint” the contours on here. - Slice. Z-Normal. Show Plane off. Apply.
We are going to contour by Temp, so lets paint by the same. Reset to get the slice to be a good size. - Paint by Temp. Reset.
Create the contours on Temp. Notice that we want more than one contour. These will be 1d lines. - Contour. Contour by: Temp. Delete the current value, add range. Use 8 Steps. Check the Compute Scalars checkbox. Apply.
- Color by Solid Color (we want white lines). Turn visibility ON for the Slice.
Notice the stitching on the lines. - Click on Contour in the pipeline browser. In the properties tab, Advanced tab, Transforming, change Translation Z to 0.001.
Now, we want to find the cells along a line, through the contour lines. We will then label these. For fun, lets make the slice at 45 degrees. Although hard to see, we are going to extract about 12 to 16 points. - Slice. Change Normal to 0.707, 0.707, 0.0. Apply. Turn off show plane.
- Select Cells On. Rubber band select the whole screen. Now, all points are selected.
- Find Data. Point Labels. Temp.
- Be sure that visibility is ON for Slice, Contour and the second Slice.
