Plot contours on surface of volume

Hi,

I feel like this should be a simple question with an easy answer but I haven’t been able to find the right information online yet to help me solve it. What I would like to do is to apply a filter that plots the contours of a particular nodal property onto the surface of a volume.

For example, I have an mesh consisting of cubes where each cube has a nodal value. I’d like to plot the contours that represent these nodal values, but on the surface of the volume. Ideally this would still work when looking at cross-sections, and if possible I’d like to add contour labels.

Can anyone point me in the right direction to get this working?

Thanks!

By plotting the contours on the surface, I assume you are really looking for a way to color the surface that draws lines on the surface?

This is pretty easy with the color map editor. Open the color editor with the pqEditColor toolbar button. The color mapping has a special Color Space named Step that makes discrete transitions that behave like contour lines. If you click the favorites pqFavorites button, you can use the search bar to search for color maps with the name “step”. You can use one of those to create images like this:

These color maps are easy to edit to place the contours where you want. Just move the control points to where you want. Here is an example where I moved (and deleted) the points to place contours at 100 and 200.

Thanks, this looks like it will be fairly close to what I want! With regards to the steps you listed when I click on the colour editor toolbar nothing happens. Any idea what might be wrong with my data or the way I have things set up?

Eventually I would like to have the contours as lines rather than have the whole volume filled with colour (so that I can represent a different data type simultaneously beneath the contour lines), is that possible?

The right part of your GUI (with the colored triangle thing) is the color editor. You are not seeing anything happening when you click the color editor toolbar button because the color editor is already open.

If just want lines on the surface, you can run the Contour filter on a surface. You can use the Extract Surface filter to get the external surface of a volume or the Slice filter to get a plane in the middle of the volume. When you run Contour on a surface, you get lines.

Thanks again, I almost have it but something is still a little off. The first problem (and this may not actually be part of the bigger issue): The original volume, the surface and the contours are not stacked in my pipeline browser and I don’t know why that is:
image

The contours are in the right location, but are plotted within the volume still:

…it’s a bit more clear that the contours are also internal when plotted with the volume:

Might this be because my volume is an unstructured grid consisting of numerous cuboids rather than one continuous volume? The vertices are shared though, so it is continuous in the sense that every cuboid connects exactly with those that are adjacent…but it seems as if the surface is actually internal on every cell (image below is a cross-section of the ‘surface extraction’):

If this is the case, is there a filter that can be applied to pre-process my volume to merge it into a single continuous volume that can be converted into an external surface only, or a way to modify the extract surface filter to omit internal faces?

Thanks for your help, it is much appreciated!

I suspect the problem is that the hexahedra (cuboids) are not connected face-to-face correctly like you think. You could try running the the Clean To Grid filter on the volume before extracting the surface.

I can’t diagnose the problem any more unless you share some example data.

1 Like

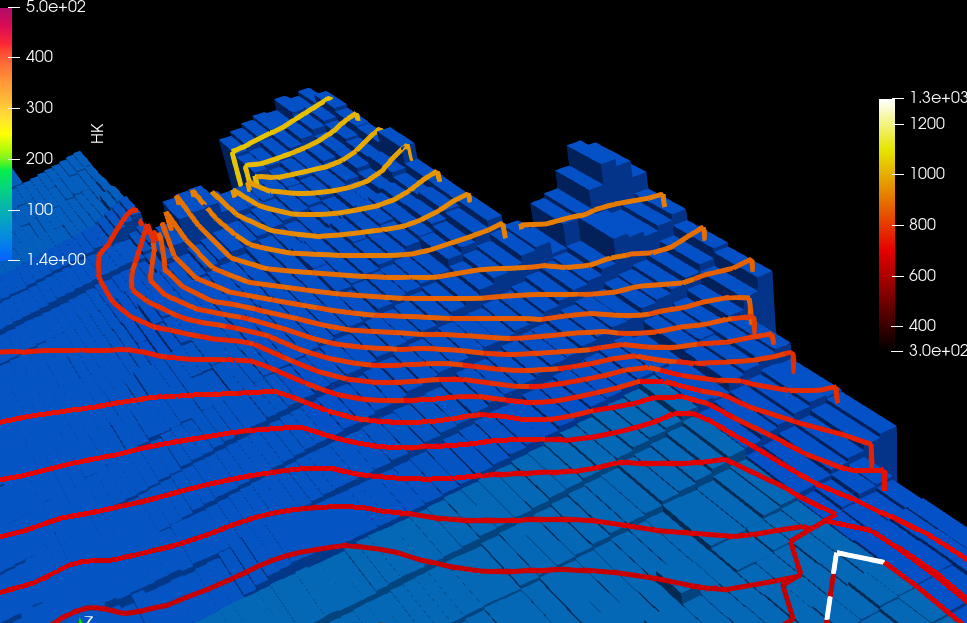
Clean to Grid filter did the job! Thanks! So the pipeline was my unstructured grid volume → Clean to Grid → Extract to Surface → Contour.

Last question, are contour labels supported yet? I did a fair bit of googling and it sounds like it might be a feature request that has been pushed back for several years? I did find a post here talking about it that might have a temporary solution (Is it possible to add labels to contour lines? - #15 by wascott), I will attempt that and see what I get.

Thanks again!

1 Like

Hello,
Can one colour the bounds to black lines between the selected contours?
Thanks in advance,

I don’t understand if you are asking whether you want the contour lines colored black or you want colored contour lines on a black surface of the object. Either way, select the object in the Pipeline Browser that you want black, change the field chooser in the second toolbar to Solid Color and then click the Edit Color Map to change that color to black.

Dear Kenneth,
Thanks for your prompt response,
Actually, I’m after colouring the bounds in black as seen in the Demo pic below; is it posible?
image