Hello everybody, this is my first topic,
I’m a PhD student in computational chemistry, i would like to visualize the isosurface of the Electron Localization Function (ELF) using Paraview software, but i didn’t succeed. I hope you can help in my issue.
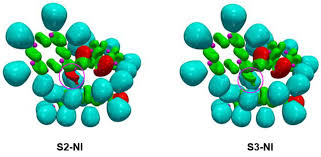
An example :
I don’t think I can tell what is going on just with those images. Usually the quickest way for someone to help is if you post an example of the data you are using to generate the pictures and a description of the steps you took to make the images.
Dear Kenneth Moreland,
My purpose is to generate like those pictures, but i don’t know how, some articles in computational chemistry used Paraview software to make the visualization.
Normally, i used other software like PyMol to perform the same job using two files,
file_elf.cube & file_esyn.cube.

I’m not familiar with PyMol .cube files. Can you post your files so that we can take a look at the contents to see if we can find what you are looking for?
Dear Mr. Kenneth Moreland,
I uploaded the files on mediafire
http://www.mediafire.com/file/5v6kfdezjx41tx8/S1_elf.cube/file
http://www.mediafire.com/file/hv020f1d3pd44sq/S1_esyn.cube/file
Any suggestions !!!
Here it is, you were looking for RessampleWithDataSet filter.
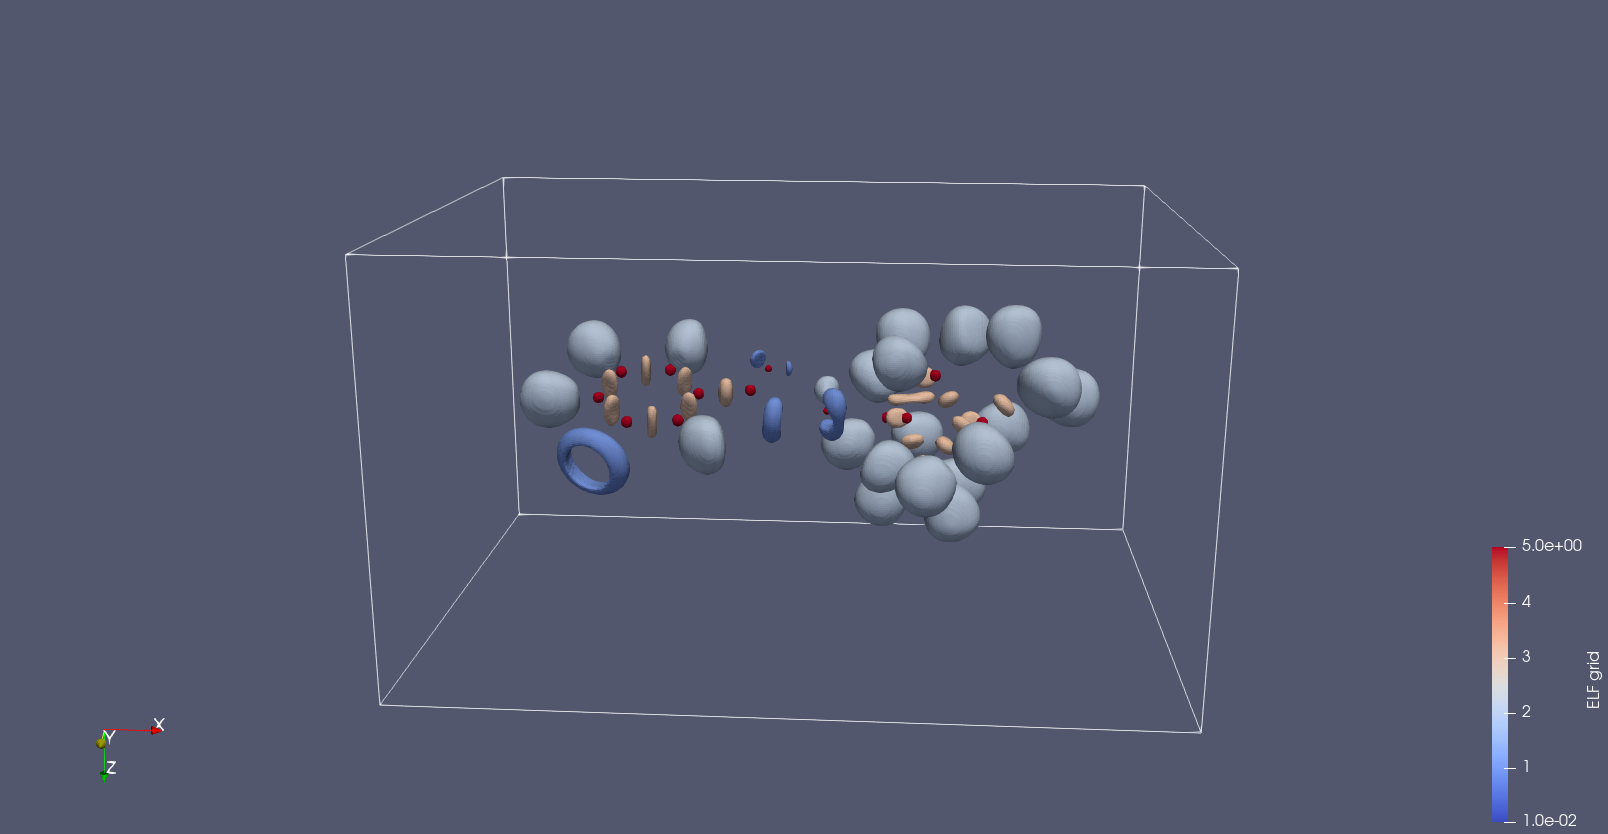
Here is a statefile you can load in ParaView, make sure to point the file to their correct path when loading the state.
mol.pvsm (534.6 KB)
Dear Mathieu Westphal,
Thank you very very much.