Hi! I’m experiencing issues with ParaView’s “Plot Over Line” filter when visualizing higher-order finite element data (polynomial order > 2) exported in VTK format.
To demonstrate the issue, I created a test case using continuous Lagrange finite elements on a structured quadrilateral mesh (4×4 elements on the unit square). The finite element space consists of piecewise polynomials of degree order, and I interpolate the function f(x, y) = x³·y³ onto this space. The data is generated from FEniCSx as follows:
import dolfinx # tested with version 0.9.0
from mpi4py import MPI

# Create mesh
mesh = dolfinx.mesh.create_unit_square(MPI.COMM_WORLD, 4, 4, dolfinx.mesh.CellType.quadrilateral)

# Define function space and function with order 3
order = 3
V = dolfinx.fem.functionspace(mesh, ("Lagrange", order))
u = dolfinx.fem.Function(V)

# Interpolate cubic function
u.interpolate(lambda x: x[0] ** 3 * x[1] ** 3)

# Export using VTK writer
vtk_writer_u = dolfinx.io.VTKFile(mesh.comm, "u.pvd", "w")
vtk_writer_u.write_mesh(mesh, 0.0)
vtk_writer_u.write_function(u, 0.0)
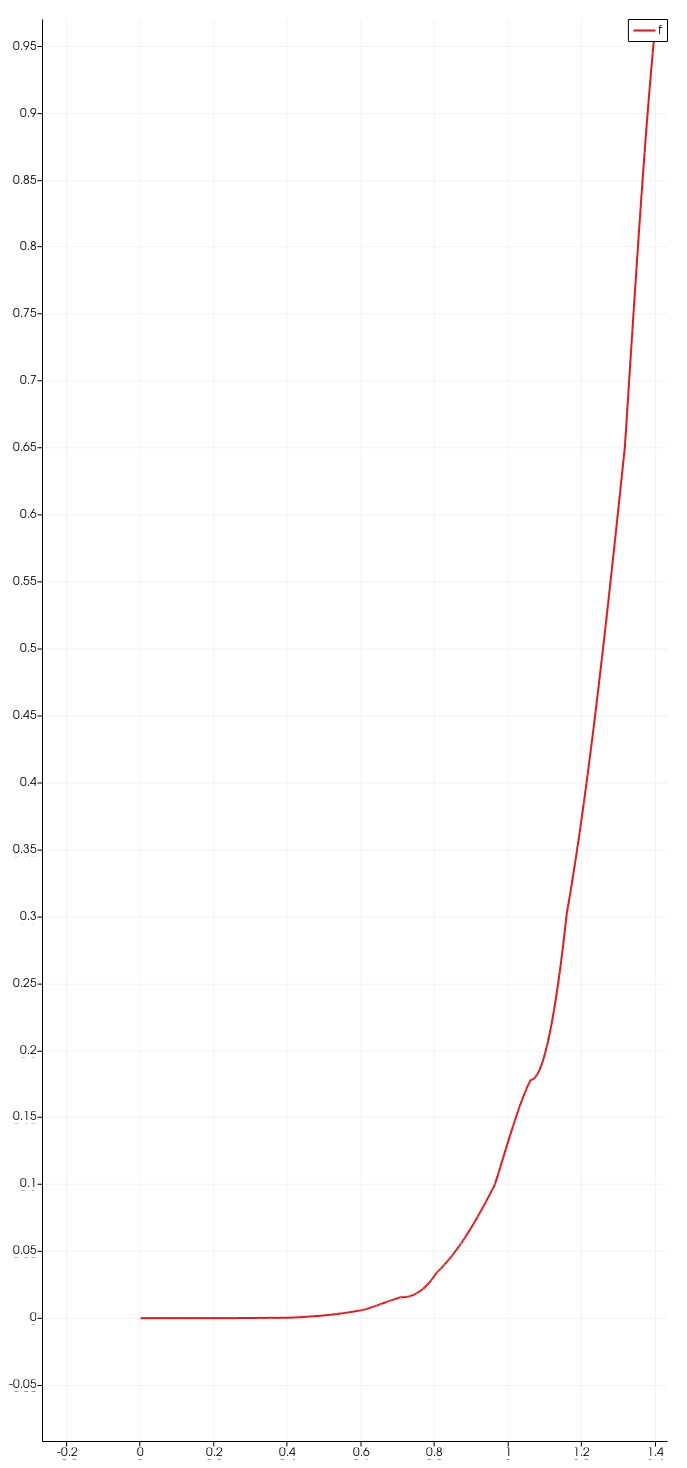
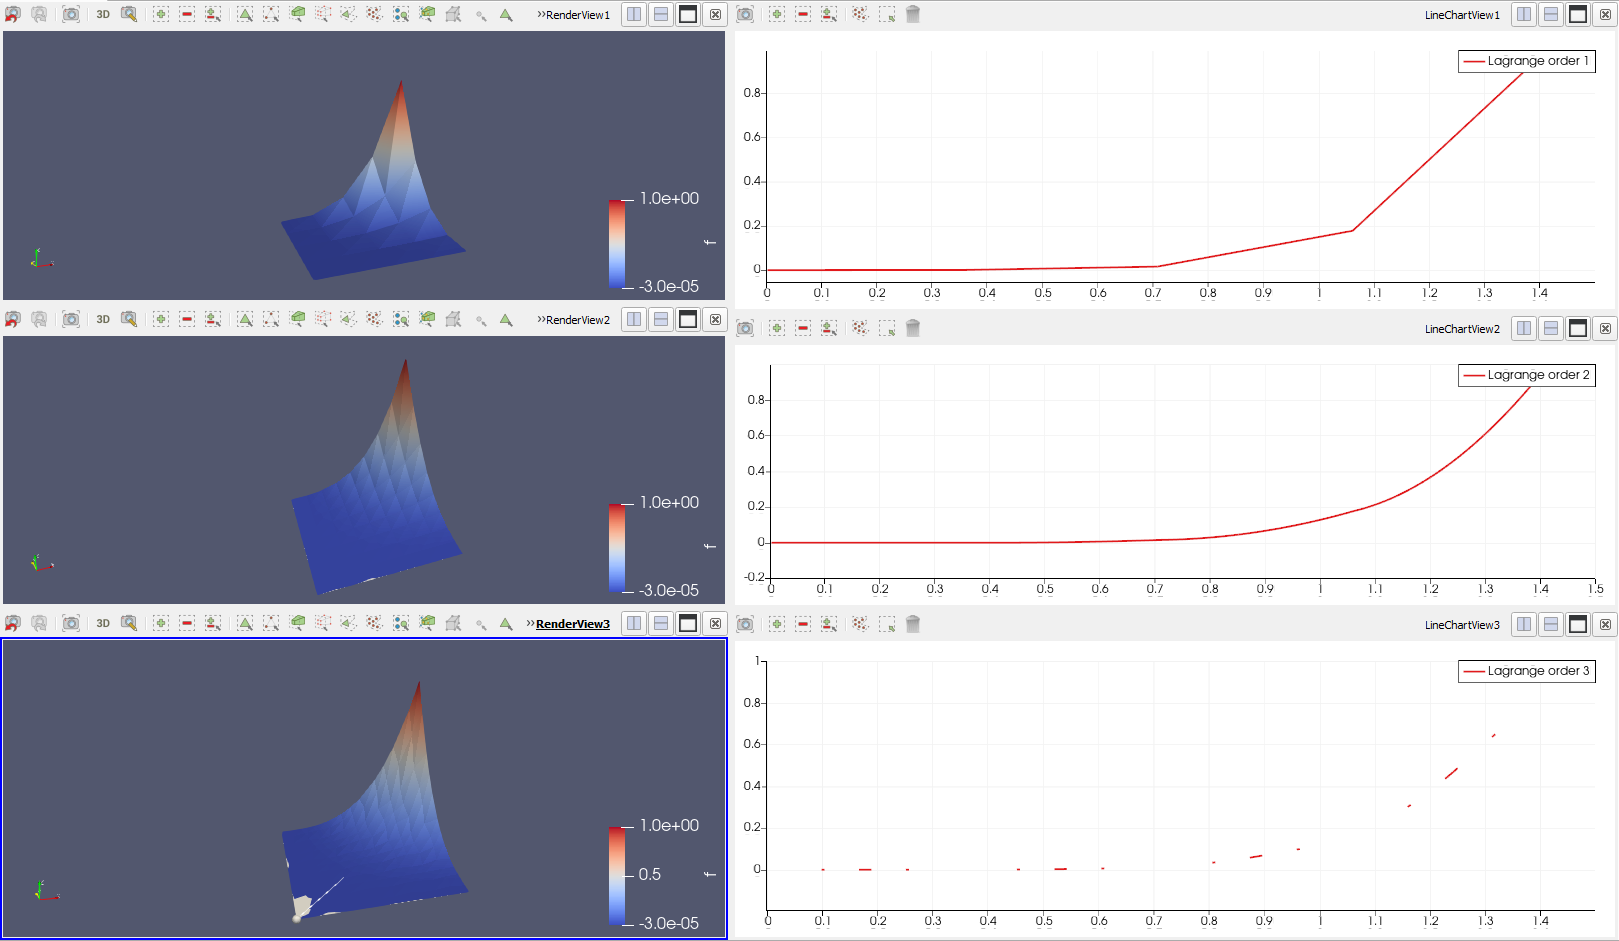
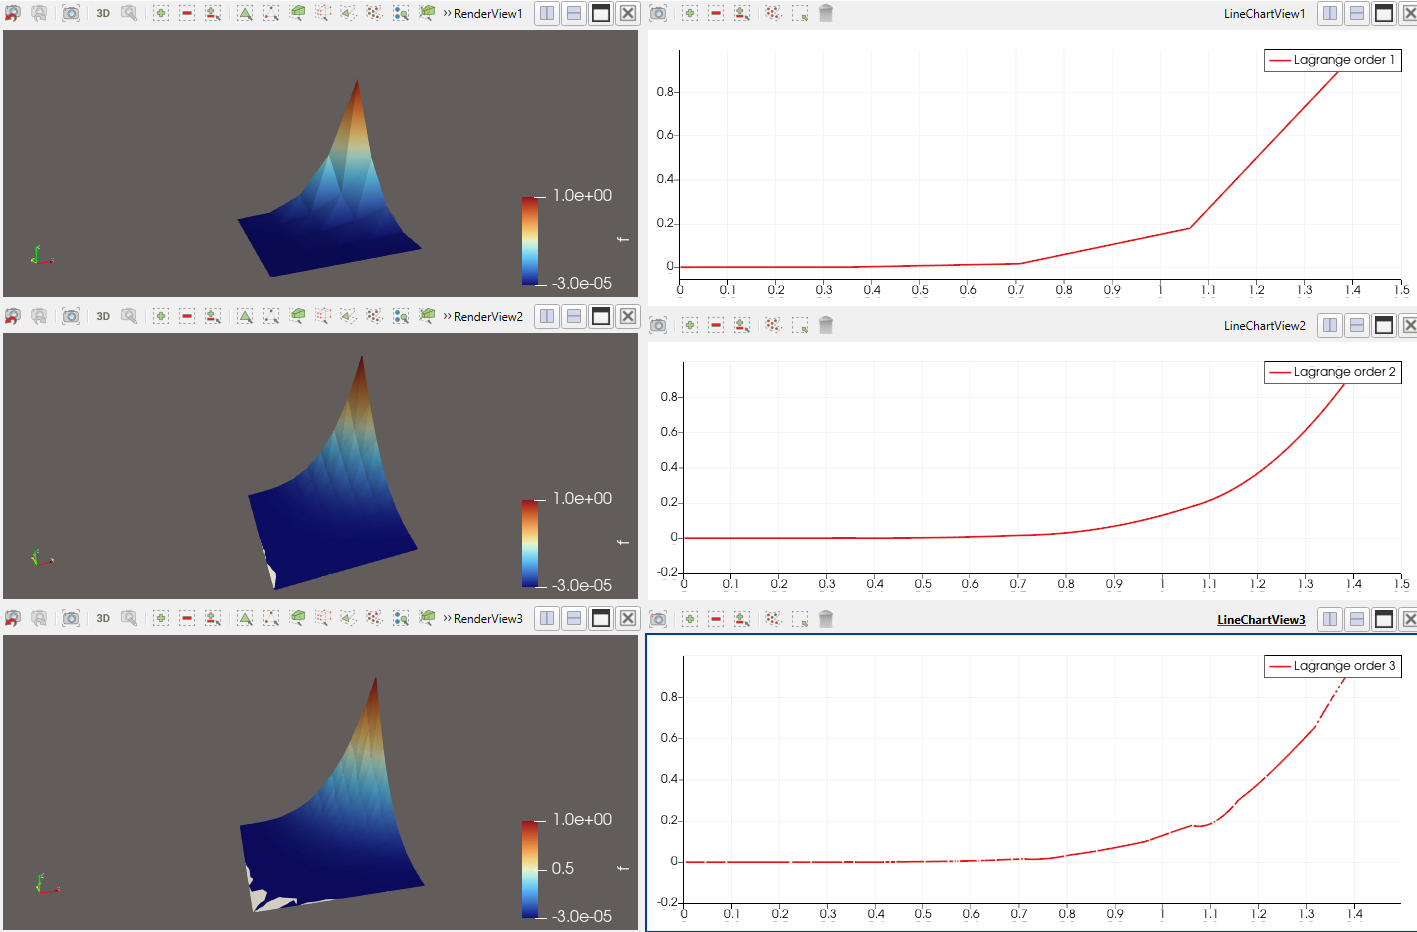
When visualizing the results in ParaView, the “Warp By Scalar” filter produces the correct and continuous surface for all polynomial orders I’ve tested. However, the “Plot Over Line” filter shows unexpected behavior for higher-order polynomials (demonstrated here with order = 3):
- In ParaView 5.13.3, the plot appears as a dotted line.
- In ParaView 6.0.0, the plot is also dotted and also does not follow the interpolated cubic function.
I’ve encountered this issue on both Windows (ParaView 5.13.3 and 6.0.0) and Linux (ParaView 6.0.0). I am also attaching the zipped data to this post.
Paraview 5.13.3 (from top to bottom order=1,2,3):
Paraview 6.0.0 (from top to bottom order=1,2,3):
I have also posted a question on this on the FEniCS discourse. Is this a known limitation or bug with the “Plot Over Line” filter for higher-order elements?
Is there a recommended workaround?
Any insights would be greatly appreciated. Thanks in advance!
results.zip (4.8 KB)