Hello,
I am new to paraview and I am encountering issues to present particle trajectories from lagrangian data.
I have .dat files with multiple timesteps with the following structure (similar to tecplot files) :
TITLE = “Lagrangian tracking”
VARIABLES = “x[mm]” “y[mm]” “z[mm]” “I” “Vx[m/s]” “Vy[m/s]” “Vz[m/s]” “|V|[m/s]” “trackID”
ZONE T=“Snapshot 0000”
STRANDID=1, SOLUTIONTIME=0
I=6703, J=1, K=1, ZONETYPE = Ordered
DATAPACKING = POINT
0 0 0 0 0 0 0 0 0
1 2 3 4 5 6 7 8 9
ZONE T=“Snapshot 0001”
STRANDID=1, SOLUTIONTIME=0.00120192
I=7190, J=1, K=1, ZONETYPE = Ordered
DATAPACKING = POINT
1 2 3 4 5 6 7 8 9
11 12 13 14 15 16 17 18 19 20
.
.
.
.
each time step is separated with these lines :
ZONE T=“Snapshot 0001”
STRANDID=1, SOLUTIONTIME=0.00120192
I=7190, J=1, K=1, ZONETYPE = Ordered
DATAPACKING = POINT
I converted the file to multiple .vtu files for multiple time steps, i imported them into paraview and were recognized as timesteps. I would like to represent the trajectories of the particles based on their positions through the time steps using paraview. Basically the idea is to be able to show the particles’ positions at succesive time steps (based on it’s trackID) as lines or tubes (similar to the following image). However the Particlepath and particletracer filters are disabled. :
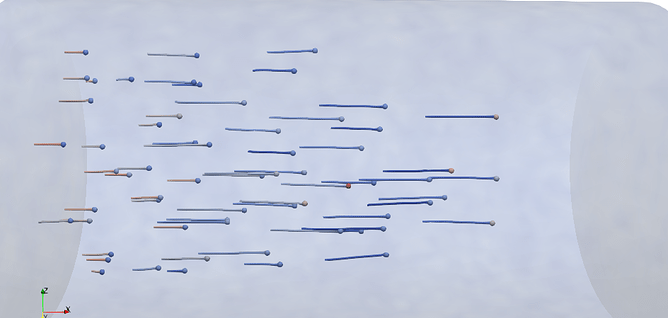
I don’t know if anyone have an idea on how I can do that?
Thank you in advance.