Hi all,
I have 2 linear plots from 2 different value, and I plan to compare them, but as x- axis does not match (due to font or the left axis values).
Is it possible to adjust both x-axis in 2 plots.
Cheers
please share your data
Thanks Mathieu and sorry for being late,
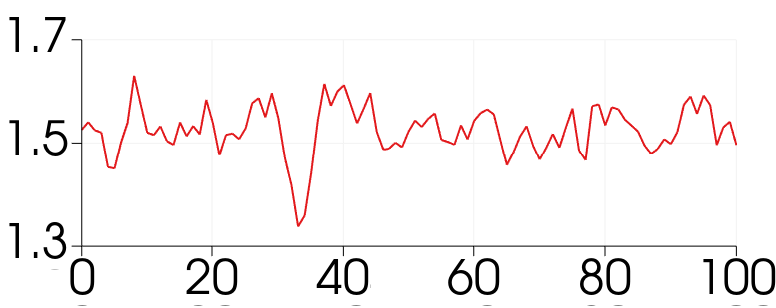
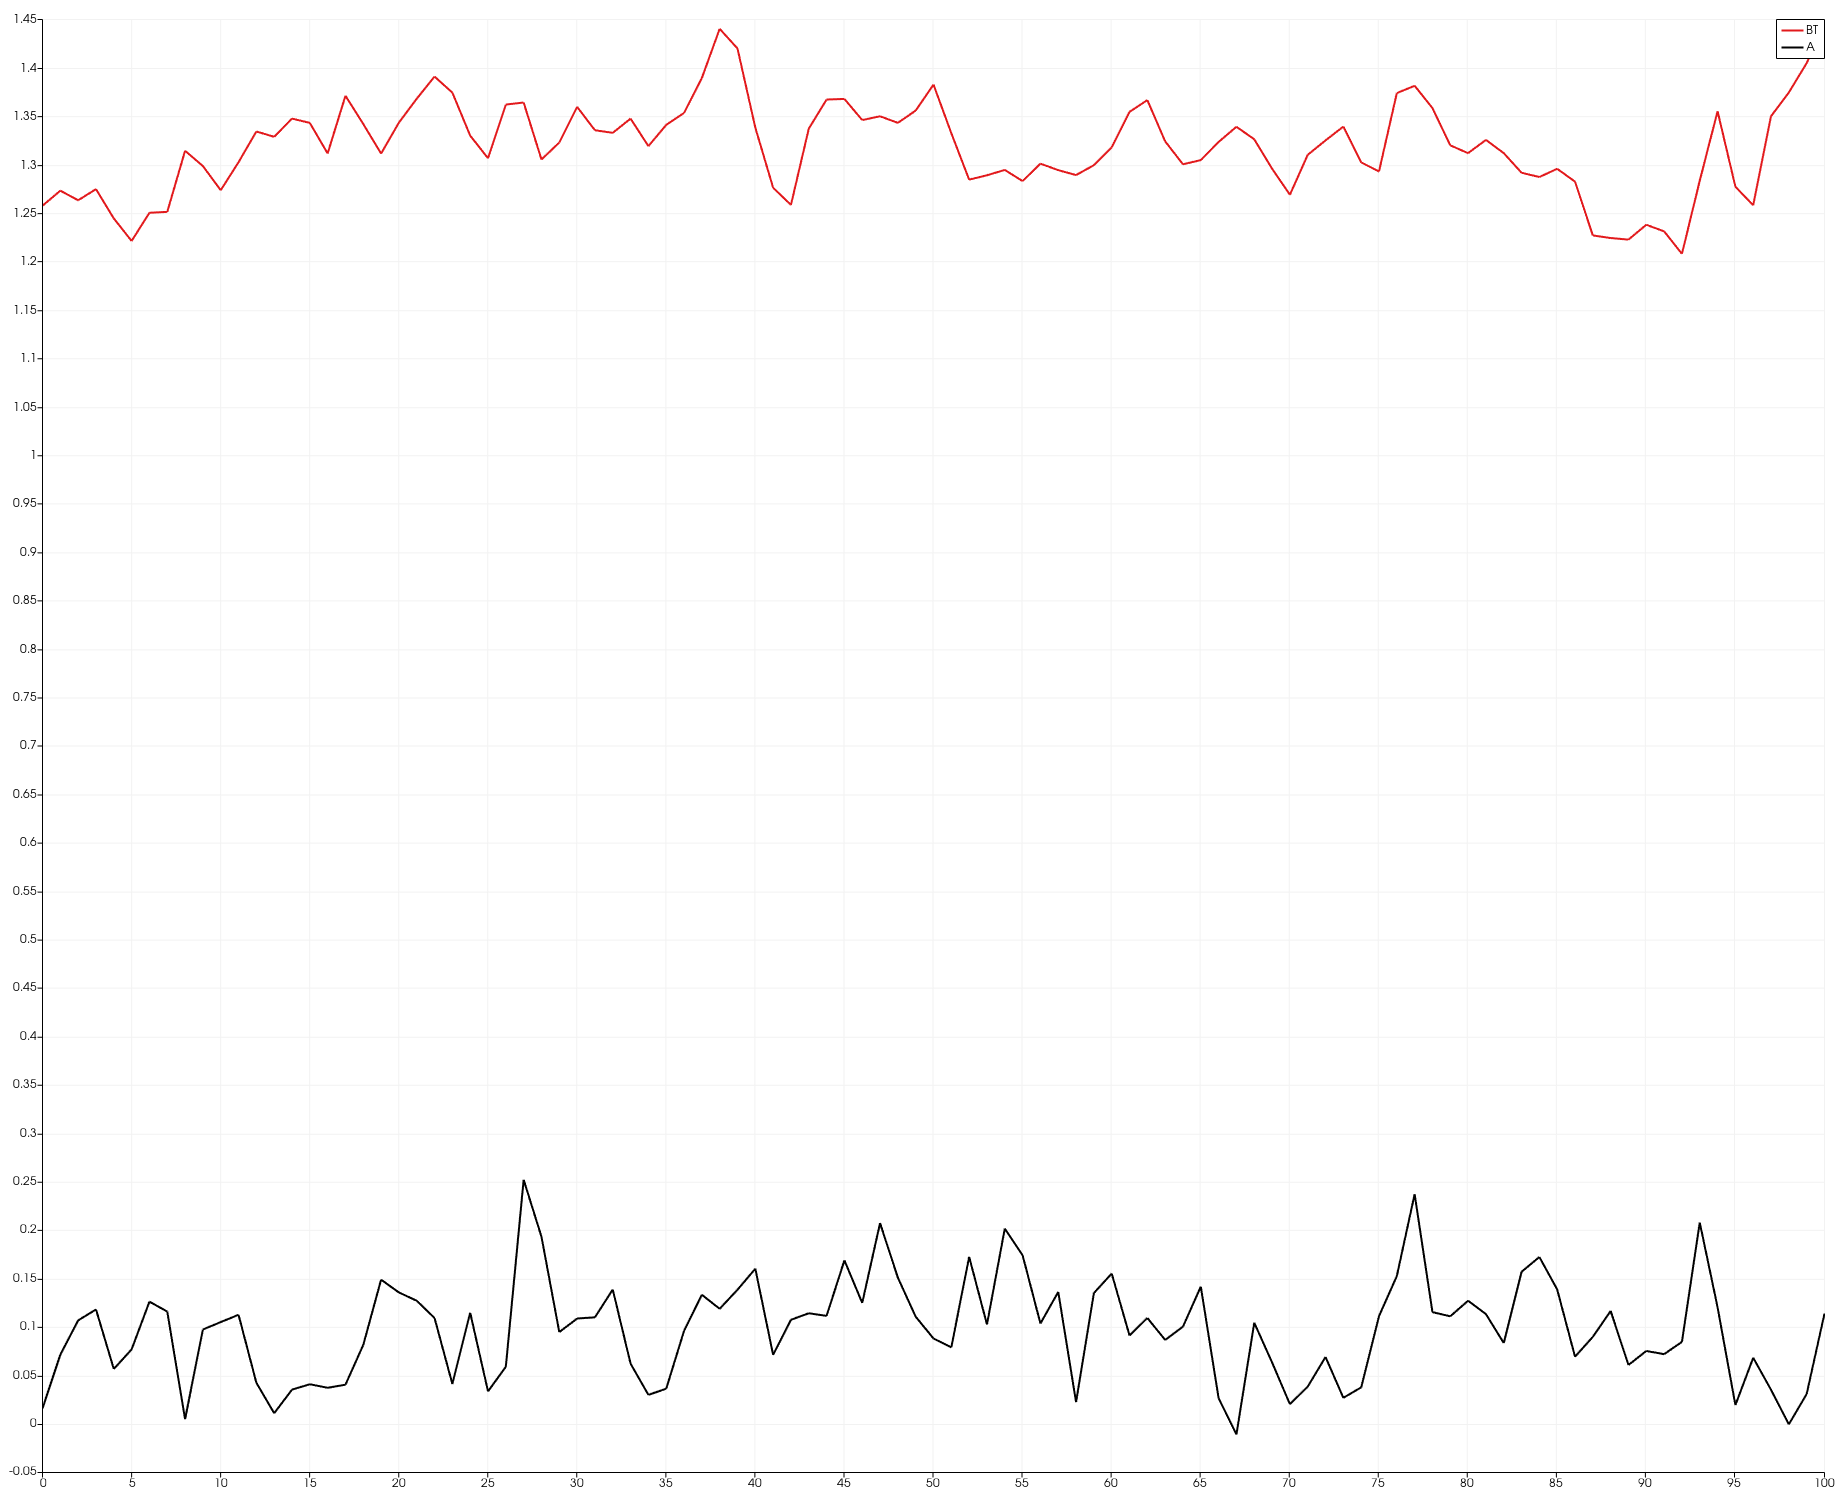
please compare these 2 columns (BT, Ap1t).
Also, if plots saved in a separated figures would be better.
out3_BT.csv (703 Bytes)
out4_Ap1t.csv (1.1 KB)
Later I can merge the figures.
Then you have to configure your axis manually to make sure they are similar.
Thanks Mathieu, In case is there any tools to fix the x axis length in the linear plots.