Dear expert,
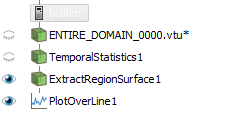
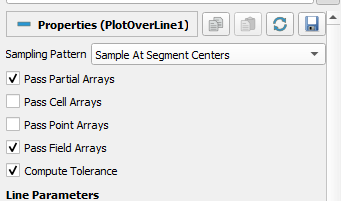
I want to know the exact data size when I use the axial plot. I am using the Temporal statistics Filter to get the average field data and using samples at segment centers for the plot. The grid size is (200*30), but when I apply this filter I get an axial 400 data points on an axial plot over a line, could you suggest to me how I can get this and how the temporal statistics filter works?