Hi,
Our group is using Catalyst / ParaView 5.6.3 to visualize the results of a Nek5000 simulation on a Cray XC40 system. The Catalyst adapter (written in Fortran) allows access to an unstructured grid with three different arrays. Currently our Catalyst pipeline is computing only either a single slice or a contour on one of the arrays.
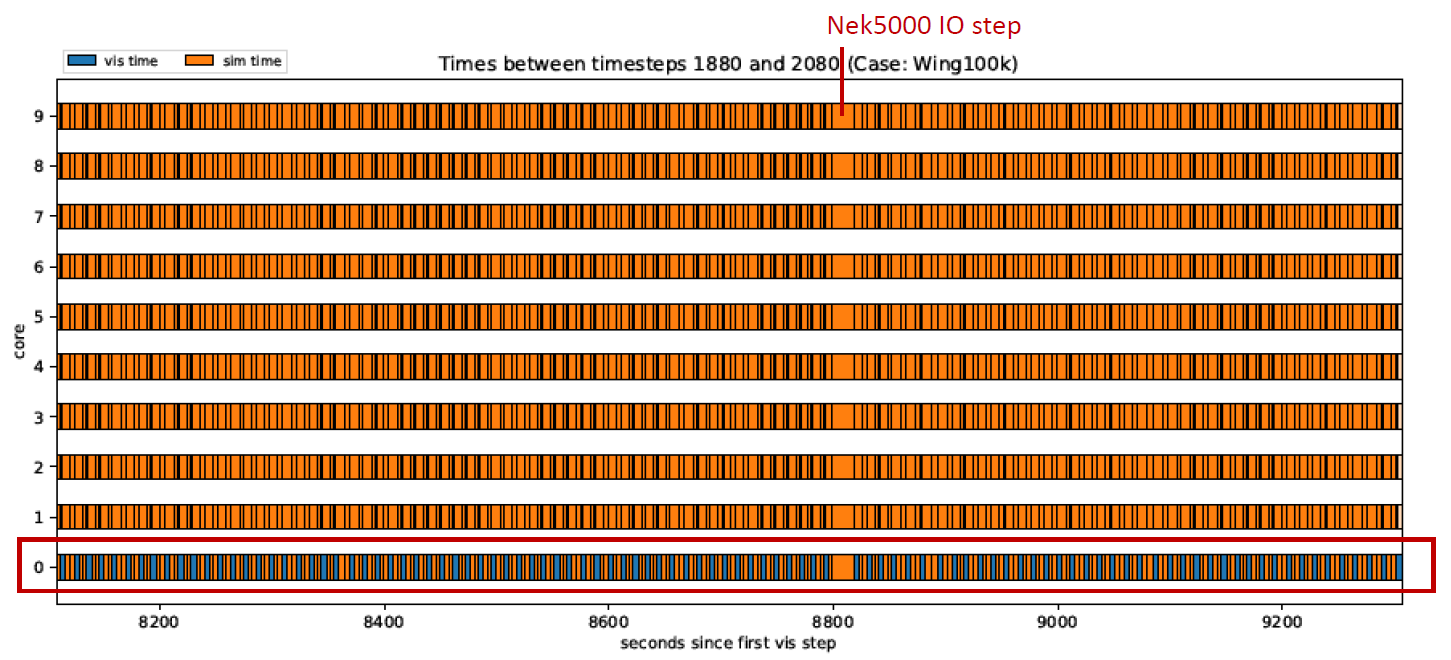
We are observing some serious load imbalance that slows the simulation and where wondering if we are maybe missing some setting in our ParaView/Catalyst setup or if this is a plausible behavior for our type of data and operation?
We have run different cases with 32 to 2048 MPI ranks. The number of grid points per rank ranges from 21,000 to 189,000. Each MPI rank writes out timestamps before and after each call to Catalyst.
In all cases, MPI rank 0 takes on the order of 5-10 seconds more to complete the Catalyst call while all other ranks seem to be idle. We can see similar behavior even for a smaller number of processes and a smaller data set on a local machine with Ubuntu.
My current guess is that this could be image compositing or other aggregation of the results from other ranks. I attached a sample pipeline, a gantt chart for the first couple MPI ranks and our ParaView cmake command for the local machine.
We have additionally tested replacing the WriteImages(…) call with a call to Render to rule out problems with writing to disk. We further attempted to only update the geometry without rendering by calling .UpdatePipeline(), assuming that this will compute a local geometry for a contour, but not create or composite and image. See comments in the script for both approaches. In the latter case, we do not see the imbalance, but the computation times are so low that I am questioning whether I am triggering the update in the correct manner.
Any pointers or recommendations are appreciated.
Thanks!
Best,
Wiebke
Catalyst Pipeline:
vm_slice.py (24.8 KB)
ParaView CMake with Mesa 18.3.3:
    cmake \
      -DCMAKE_BUILD_TYPE=Release                                  \
      -DPARAVIEW_INSTALL_DEVELOPMENT_FILES=ON                     \
      -DPARAVIEW_ENABLE_PYTHON=ON                                 \
      -DVTK_PYTHON_VERSION=3                                      \
      -DPARAVIEW_BUILD_QT_GUI=OFF                                 \
      -DPARAVIEW_USE_MPI=ON                                       \
      -DPARAVIEW_ENABLE_CATALYST=ON                               \
      -DVTK_USE_X=OFF                                             \
      -DVTK_OPENGL_HAS_OSMESA=ON                                  \
      -DVTK_USE_OFFSCREEN=OFF                                     \
      -DOSMESA_INCLUDE_DIR=$OSMESA_INCLUDE_DIR                     \
      -DOSMESA_LIBRARY=$OSMESA_LIBRARY/libOSMesa.so                \
      -DPYTHON_INCLUDE_DIR=/usr/include/python3.6m \
      -DPYTHON_LIBRARY=/usr/lib/python3.6/config-3.6m-x86_64-linux-gnu/libpython3.6m.so   \
      -DCMAKE_INSTALL_PREFIX=/home/marco/InSituPackage/local      \
      /home/marco/InSituPackage/ParaView-v5.6.3
Gantt chart with Catalyst output frequency being set to 2: