Hello team,
I have a large *vtu files with many parameters. I want to do some further calculations on these parameters and visualize them. I know that there exist TabletoPoints filter, but I am looking to have visualization of the below sort - solid, not points. Since the calculations are complicated, I cannot directly do them using Calculator filter.
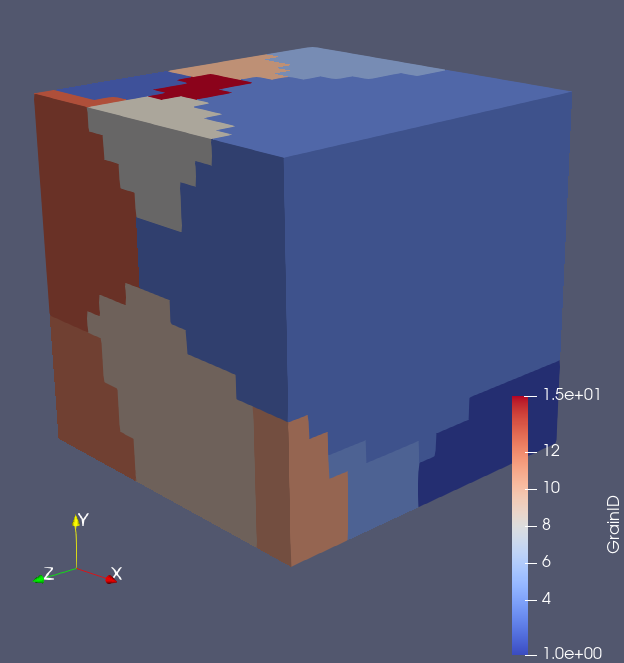
If it helps, the data points are ~1.6 million, but as can be seen from the picture above, many points will have the same data and can be reduced to as low as 55 points.
Thanks in advance,
Raghunandan.