Hi, I am mainly using netCDF data and have had mostly good success. I modify a netCDF file to have what I think is the best CF conventions, especially the bounds variables to ensure that paraview understands that the data is global and longitude covers all longitudes 0-360, a ncdump gives:
netcdf sphum0.atmos_isobaric.day.cafe88.19880101-19880131 {
dimensions:
        time = UNLIMITED ; // (31 currently)
        level = 21 ;
        lat = 90 ;
        lon = 144 ;
        latb = 91 ;
        lonb = 145 ;
        bnds = 2 ;
variables:
        double time(time) ;
                time:units = "days since 1970-01-01 00:00:00" ;
                time:calendar = "JULIAN" ;
        float level(level) ;
                level:long_name = "pressure" ;
                level:units = "hPa" ;
                level:positive = "down" ;
                level:cartesian_axis = "Z" ;
                level:axis = "Z" ;
        double lat(lat) ;
                lat:long_name = "latitude" ;
                lat:units = "degrees_north" ;
                lat:edges = "latb" ;
                lat:cartesian_axis = "Y" ;
                lat:bounds = "lat_bounds" ;
        double lon(lon) ;
                lon:long_name = "longitude" ;
                lon:units = "degrees_east" ;
                lon:edges = "lonb" ;
                lon:cartesian_axis = "X" ;
                lon:bounds = "lon_bounds" ;
        double latb(latb) ;
                latb:long_name = "latitude edges" ;
                latb:units = "degrees_north" ;
                latb:cartesian_axis = "Y" ;
        double lonb(lonb) ;
                lonb:long_name = "longitude edges" ;
                lonb:units = "degrees_east" ;
                lonb:cartesian_axis = "X" ;
        float bnds(bnds) ;
        double lat_bounds(lat, bnds) ;
                lat_bounds:history = "none" ;
        double lon_bounds(lon, bnds) ;
                lon_bounds:history = "none" ;
        float sphum(time, level, lat, lon) ;
                sphum:_FillValue = 1.e+20f ;
                sphum:missing_value = 1.e+20 ;
                sphum:long_name = "specific humidity" ;
                sphum:units = "kg/kg" ;
However, when I do a surface plot with opacity set to some value like 0.5 I get a result mostly expected, except for the slice taken out at 0 longitude:
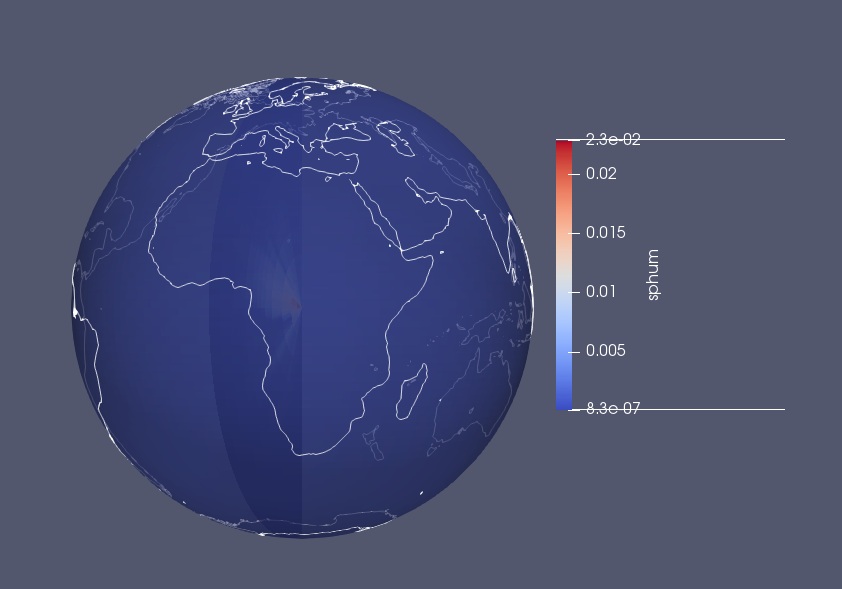
I have done no more than open the file using the netCDF filter, kept spherical coordinates box checked and adde some continents to help with reference. If I line up the 0 longitude to face exactly outwards, it is very thin, however, it gets shaded when at an angle as I am thinking that is is being treated as a void.
Any help would be great.