Looking for example RGB(A) volume data

Hello,

I have some RGB color data in as a TIFF stack that I will be visualizing in ParaView, once I figure out how to get the data properly imported.

So my primary task is to figure out what VTK format to use (and perhaps which Python-VTK package to use – e.g. pyevtk or tvtk) to help my convert/import the data into ParaView. (And before you suggest, I’ll mention that ParaView seems to have trouble reading my TIFF image stacks, which is something I’ll post in a separate thread.)

Having encountered a lot of difficulty tracking down example code for this, I figured the next best thing is to track down an existing VTK file that contains a 3D block of colors. I have to think such an example is out there, but there’s so much noise from the search that I haven’t found anything good yet.

So I’m hoping there’s at least a quick answer to point me to an example of a block of RGB colors.

I did do a search of this Discourse server before asking, and I found a couple of relevant questions, both posted in the last 18 months or so, but neither answered, so I’m hoping there’s at least an answer to my search for an example file.

Thanks, Bill

Hi Bill,
Though I am not sure how you store the RGB color data in TIFF.
Regarding to setting color on volume, Categorical Colors might be something you are searching for, however it cannot support volume representation now.
“Interpret Values as categories” does not work with Volume rendering for TIFF series reader (#22299) · Issues · ParaView / ParaView · GitLab (kitware.com)

You can still use Categorical Colors in surface representation. Otherwise, handcraft your own Categorical Colors by setting color map is another practical approach.
Here’s an easy example of how to set RGBA in pvpython (RGB here is between 0 and 1):

colorMap = GetColorTransferFunction(sourceName)
colorMap.RGBPoints = [
  index1, R1, G1, B1,
  index2, R2, G2, B2, ...
]

opacityMap = GetOpacityTransferFunction(sourceName)
opacityMap.Points = [ ... ]

Check this official document for more.
Hope these information can help you with your question!

Hi Fashing,

Unfortunately, I’m not looking for categorical colors, I have an RGB color value assigned to each point in a regular 3D image dataset, and I want to use that color. (Ultimately, I’m going to want to set opacity off a different value.)

Thanks for the suggestion though, but I’m still hoping for the RGB method.
Bill

Hi,
In a vtk file you can have a point attribute (POINT_DATA) COLOR_SCALARS which can have 3 (RGB) or (RGBA) values per point. The values must be in the range 0-1 for ascii and 0-255 for binary files. Use the LOOKUP_TABLE default.
Link to vtk file formats.
Hope this helps, cheers
Venke

Hello Venke,

Thank you for the tip. So I found basically one example VTK file that uses COLOR_SCALARS, which is “texThres2.vtk”, which just has two 2 color components, which presumably are a greyscale and alpha.

So not really finding any other examples on the whole of Google, I faked one by taking the VTK example file “RectGrid2.vtk” and changing the line:
VECTORS vectors float
into
COLOR_SCALARS color 3

And I loaded that into ParaView, which sees a data type called “color”, but it still considers the values to be “X”, “Y”, “Z”, plus a calculated “Magnitude”. So I don’t see how to make ParaView treat the “colors” field as colors.

If the data is set to Magnitude then I get the following error:

[paraview        ]vtkGPUVolumeRayCastMapp:363    ERR| vtkOpenGLGPUVolumeRayCastMapper (0x9def240): No scalars named "Magnitude" or with id -1 found on input.
(1621.697s) [paraview        ]vtkGPUVolumeRayCastMapp:363    ERR| vtkOpenGLGPUVolumeRayCastMapper (0x9def240): No scalars named "Magnitude" or with id -1 found on input.

Or if I set it to the erroneously named X, I get:

(1636.359s) [paraview        ]vtkGPUVolumeRayCastMapp:363    ERR| vtkOpenGLGPUVolumeRayCastMapper (0x9def240): No scalars named "Magnitude" or with id -1 found on input.
(1636.399s) [paraview        ]vtkGPUVolumeRayCastMapp:363    ERR| vtkOpenGLGPUVolumeRayCastMapper (0x9def240): No scalars named "Magnitude" or with id -1 found on input.
(1636.416s) [paraview        ]vtkGPUVolumeRayCastMapp:363    ERR| vtkOpenGLGPUVolumeRayCastMapper (0x9def240): No scalars named "Magnitude" or with id -1 found on input.
(1636.432s) [paraview        ]vtkGPUVolumeRayCastMapp:363    ERR| vtkOpenGLGPUVolumeRayCastMapper (0x9def240): No scalars named "Magnitude" or with id -1 found on input.
(1667.310s) [paraview        ]   vtkVolumeTexture.cxx:949    ERR| vtkVolumeTexture (0x8e71eb0): Capabilities check via proxy texture 3D allocation failed!
(1667.312s) [paraview        ]   vtkShaderProgram.cxx:437    ERR| vtkShaderProgram (0xad163b0): 1: #version 150

followed by several lines of actual shader code.

So my fear is that ParaView simply can’t handle a block of colors, and in further Googling, I found this old email list conversation:

Which I think confirms my fear. But I hope I’m wrong, and if anyone can alleviate my fear I’d be much appreciated!

Bill

Just disable “Map Scalars” ?

https://docs.paraview.org/en/latest/UsersGuide/displayingData.html#fig-understandingmapscalars

Hi Bill,

I don’t know what the COLOR_SCALARS term does. But the basic story is what Mathieu pointed to: if you have a data array of integral types and they range from 0-255, you can turn off the Map Scalars property in the Display section and ParaView will interpret the data values from the array directly as colors instead of mapping them through the lookup table. This is true for single-component arrays (it results in a gray scale coloring) or 3-component arrays storing RGB data values.

Similarly, if you have floating point data values and their values are between 0.0-1.0, then turning off Map Scalars tells ParaView to interpret those values directly as colors.

So the first step is to get your data into ParaView with one of the types mentioned above (integral or floating point). The second step is to disable color mapping through the lookup table.

I hope that helps.

Hi and sorry for the late reply. As Mathieu and Cory suggested, just turn off “Map Scalars”. You can test it with any vtk-file, I just created a simple one with just 3 points.
testpoints.vtk (303 Bytes)
Cheers, Venke

Mathieu, Cory, Venke,

Thank you all for your suggestions, they have helped me increase my understanding of how to handle a volume-of-colors in ParaView.

However, it seems that ParaView actually has some issues with this type of data – and there are still some unknowns about the data formats. I know enough now that I think I can work-around any of ParaView’s issues (though perhaps not easily in the case of the final bullet), but 1) for future readers of this thread; and 2) to hopefully improve ParaView down the road; I’ll convey a bit of the issues I encountered – starting with the data file formats.

Regarding the “COLOR_SCALARS” feature of legacy .vtk files, there doesn’t seem to be any real equivalent in the XML .vti format, other than you can just have some tuples/vectors in your data. And when loading a legacy VTK with “COLOR_SCALARS” it treats it just as a regular vector, for which ParaView assumes the axes are “X”, “Y” and “Z” if there are just 3 components, and numbers “0” through “3” if there are four components. The naming isn’t a big deal, though might confuse some new users. (Maybe there’s a way to assign axis names in the .vtk format?)

Speaking of the .vti format: having a DataArray with 4 components seems to be handled just fine – except the standard “pyevtk” Python package doesn’t like 4-component data. (There’s another Python package for writing VTK files that I came across, but I can’t find my reference to that anymore, so can’t test that.) Also, I presume there’s a way to write the files directly with “vtkpython” or “pvpython”, but it was easier for me (and thus less time consuming) to just alter the “pyevtk” Python package to be able to handle 4-tuples.

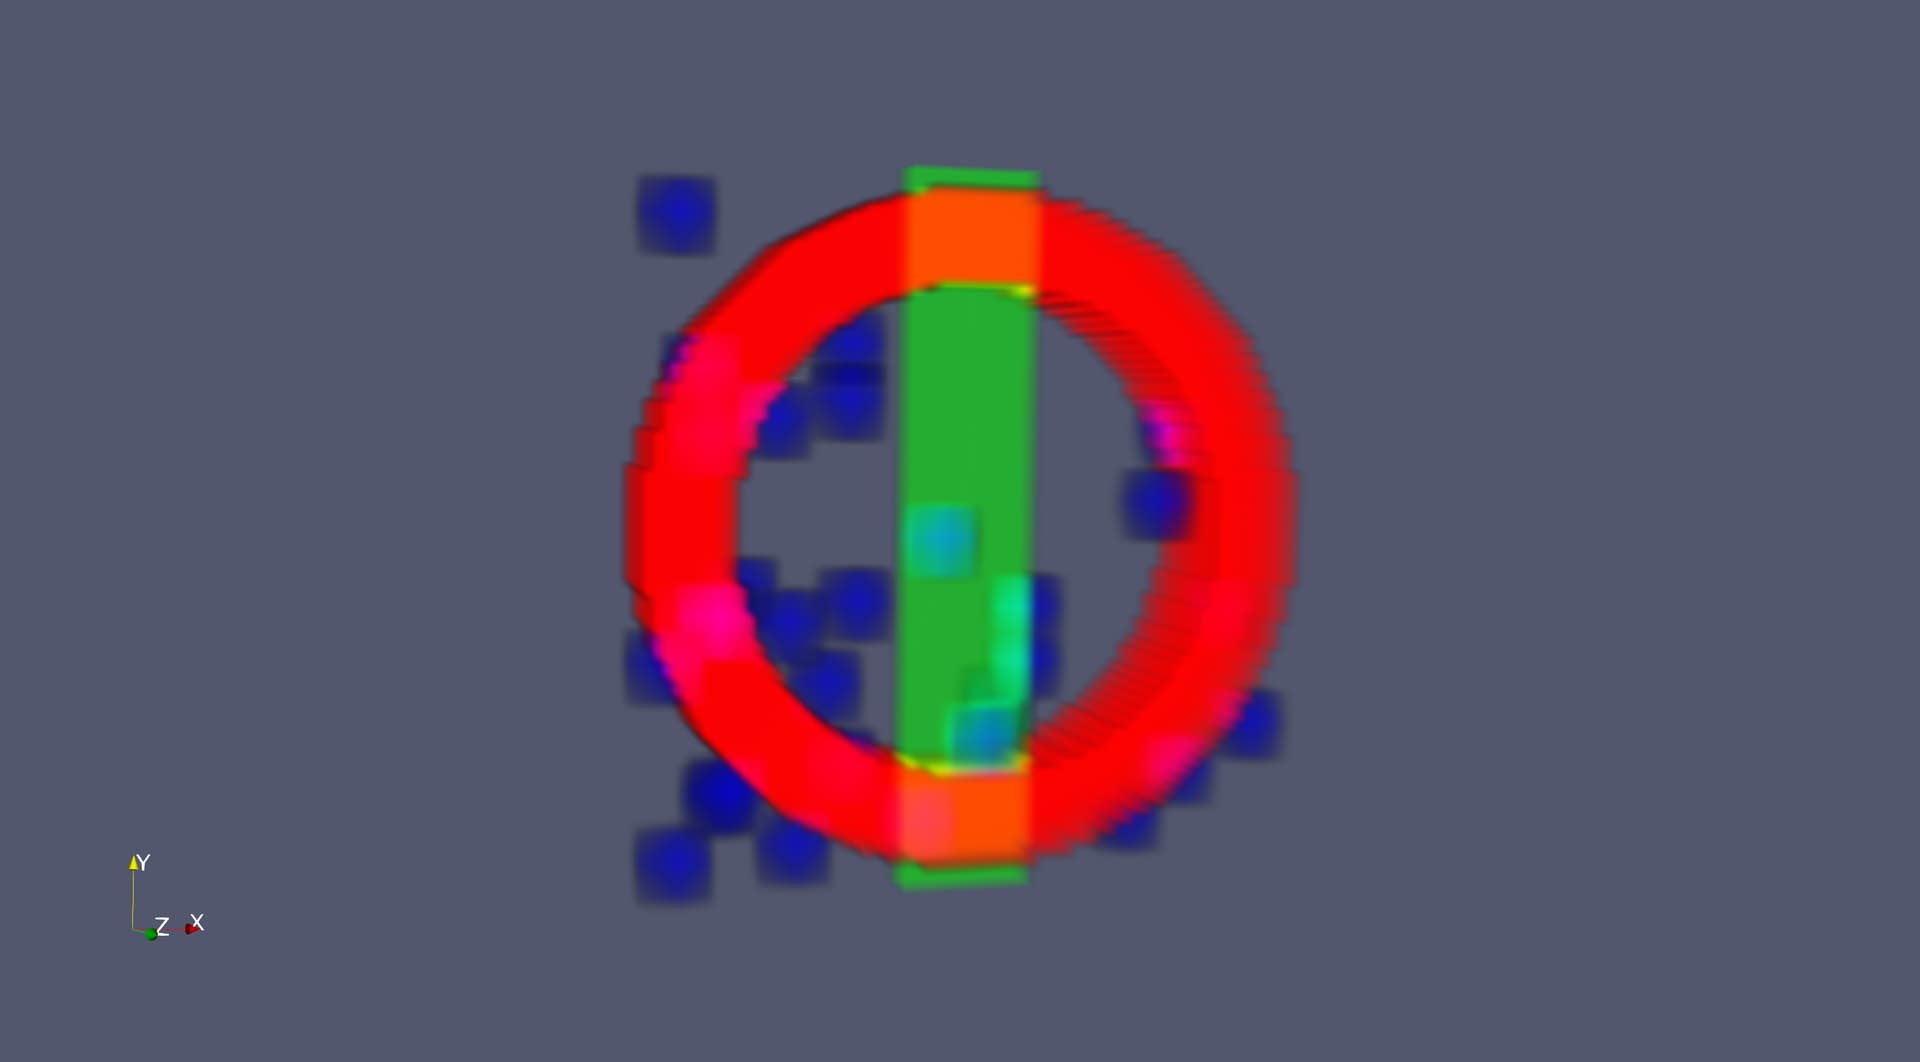
All that said, I created a sample datafile of some shapes using Numpy and then wrote them out as both “RGB” and “RGBA”, plus a scalar “intensity” value into the file. Attached is the code to generate that, though the “RGBA” data requires my modified “pyetvk”, so I have a link to the file that is generated.

And regarding the visualization: both the RGB and RGBA data fields work with the “Surface” rendering representation in ParaView. And in the one case where one wants to render the object with the exact alpha values contained in the RGBA data, then that renders fine in “Volume” representation.

However, there are other visualization choices that one may want to make. And so here are the issues that make those choices difficult/impossible:

  • When coloring by the “rgba” value in “Surface” representation, if you turn off “Map Scalars”, nothing appears. If you switch to “rgb” and back to “rgba” then you can see the semi-transparent surfaces – though “rgba” with surface rendering isn’t particularly interesting.

  • If you have the coloring set to “rgb”, and switch to “Volume” rendering representation, then you get the following error from ParaView:
    ( 291.369s) [paraview ]vtkGPUVolumeRayCastMapp:435 ERR| vtkOpenGLGPUVolumeRayCastMapper (0x153e5770): If IndependentComponents is Off in the volume property, then the data must have either 2 or 4 component scalars. The input data has 3 component(s).
    So there is some sense in that, given that the 2-tuple and 4-tuple data fields presumably have an alpha/transparency channel. However, ParaView offers the possibility of using a “Separate Opacity Array”, so probably better than the warning would be to use channel-0 (aka “X”) as the opacity when given a 3-tuple vector field. Because it is actually possible to then enable separate opacity with a 3-tuple field, and set it to another scalar in the dataset (e.g. “intensity”), or one of the vector components. However! (see next bullet)

  • A big problem is that when a 3-tuple/vector datafield (such as RGB) is volume rendered with a separate opacity – it does not seem possible to then color the data based on the RGB values! This seems like it should be doable.

  • Another problem is that when a 4-tuple/vector datafield (such as RGBA) is volume rendered, then attempting to “Use Separate Opacity Array” causes the data to just disappear. Again, I’d like to be able to keep the RGB colors, but affect the opacity based on different data fields.

Here’s the code to generate some data (in .vti format) for testing:

#####
## Generate an example VTK Image data file containing some basic shapes
#
# Based on code from: https://stackoverflow.com/questions/10031580/how-to-write-simple-geometric-shapes-into-numpy-arrays
#
from pyevtk.hl import imageToVTK
import numpy as np
np.random.seed(seed=1)

# All subsequent size values (except splatsize) are based on the "xysize"
#   (original value was: xysize = 200)
xysize = 80
zsize = xysize / 4
circle_center = xysize * xysize * 0.16
hwidth = xysize * 4

# xx and yy are xysize X xysize tables containing the x and y coordinates as values
# mgrid is a mesh creation helper
xx, yy = np.mgrid[:xysize, :xysize]

#######
## Generate a cylinder (red)
# circles contains the squared distance to the X-Y midpoint
#   we are just using the circle equation learnt at school
circle = (xx - xysize/2) ** 2 + (yy - xysize/2) ** 2
# donuts contains 1's and 0's organized in a donut shape
#   you apply 2 thresholds on circle to define the shape
#donut = np.logical_and(circle < (6400 + 60), circle > (6400 - 60))
donut = (circle < (circle_center + hwidth)) & (circle > (circle_center - hwidth))
#print("circle_center = " + str(circle_center))
donut3D = np.repeat(donut[:,:,np.newaxis], zsize, axis=2)

red = donut3D * 0.8
#imageToVTK("donut", pointData={"donut":red})

#######
## Generate a square rod through the center (green)
x2, y2, z2 = np.mgrid[:xysize, :xysize, :zsize]
green = ((x2 > xysize*0.4) & (x2 < xysize*0.6) & (z2 > zsize*0.3) & (z2 < zsize*0.7)) * 0.5
#imageToVTK("csg", pointData={"donut":red, "rod":green})

#######
## Generate some random splats (blue)
splatsize = 4
blue = np.zeros(green.shape, dtype=green.dtype)
for count in range(30):
    x3 = np.random.randint(splatsize+1, high=xysize-splatsize-1)
    y3 = np.random.randint(splatsize+1, high=xysize-splatsize-1)
    z3 = np.random.randint(splatsize+1, high=zsize-splatsize-1)

    for i in range(-splatsize, splatsize):
        for j in range(-splatsize, splatsize):
            for k in range(-splatsize, splatsize):
                distish = abs(i) + abs(j) + abs(k)
                blue[x3+i, y3+j, z3+k] = ((splatsize*3.0) - distish) / (splatsize*3.0)

intensity = (red + green + blue) / 3.0

shapesRGB = (red, green, blue)
shapesRGBA = (red, green, blue, intensity)
imageToVTK("sampleRGB-" + str(xysize), pointData={"rgb":shapesRGB, "intensity":intensity})
#imageToVTK("sampleRGB-" + str(xysize), pointData={"rgb":shapesRGB, "rgba":shapesRGBA, "intensity":intensity})

And here’s a link to some pre-generated data which includes both the “rgb” and “rgba” fields (plus a scalar “intensity” field): Download: https://freevr.org/Downloads/sampleRGB-80.vti

The link seems non fonctional

Aha, that’s because it’s an XML file, so your browser tries to interpret it. I found that “wget” works to download it.

VolumeRendering with RGBA without MapScalars seems to be what you are looking for:

To a degree, yes for the “RGBA” version of the data. But, there are still the problems listed above:

  • I can’t use “Use Separate Opacity Array” with the “rgba” data
  • I can’t volume render the “rgb” (w/o “a”) data as RGB – it reverts to using a colormap

Thanks, Bill

These feature are indeed missing.