Hi everyone,
I am using ParaView from the GUI, and I am using the PlotOverLine filter to evaluate my normal stress results on specific boundaries. Specifically, what PlotOverLine shows is Stress0.0_Magnitude.
I then select the filter and export the csv file. The resulting .csv file does not show Stress0.0_Magnitude, but it shows absolutely everything else. Furthermore, I don’t know what the magnitude is because I don’t even understand what the other values are (e.g. Stress0.0_0 up to Stress0.0_8). Is there any way I can just export the data points of what is actually plotted in ParaView using PlotOverLine? I am so confused. The source file should have the normal stress evaluated everywhere, so plotting this value over a specific line should just give the normal stress over that boundary.
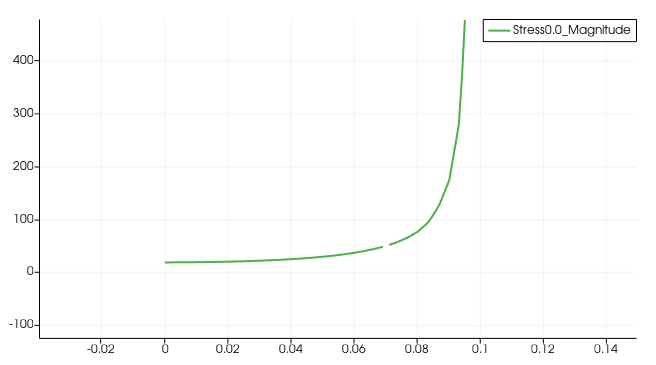
This is what ParaView plots for me (and what I want to export):
And this is a screenshot of what I get from exporting the .csv file:
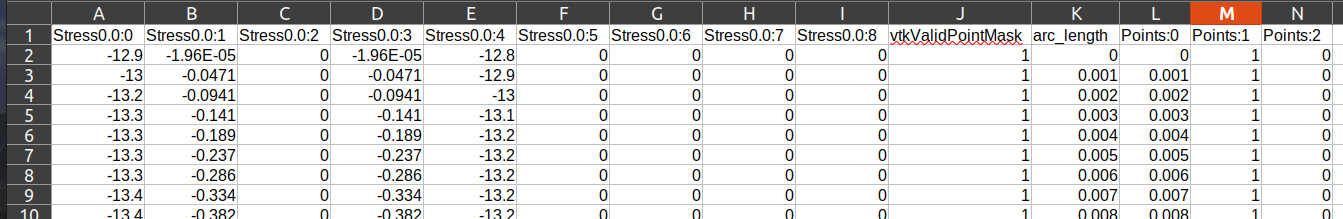
No Stress0.0_Magnitude 
Any help would be greatly appreciated!
