Hi! I am running a simulation using Fipy which outputs the solution as .vtk files. When I do a mpirun, the solver splits the domain into subdomains which is then outputted as separate VTK files. I am trying to use Paraview to visualise the results, but I cant seem to overlay / append the results since the subdomains themselves are overlapping.
Hi! Thanks for the super quick help. The simulation software is pretty great otherwise, so im just going to have to hack this
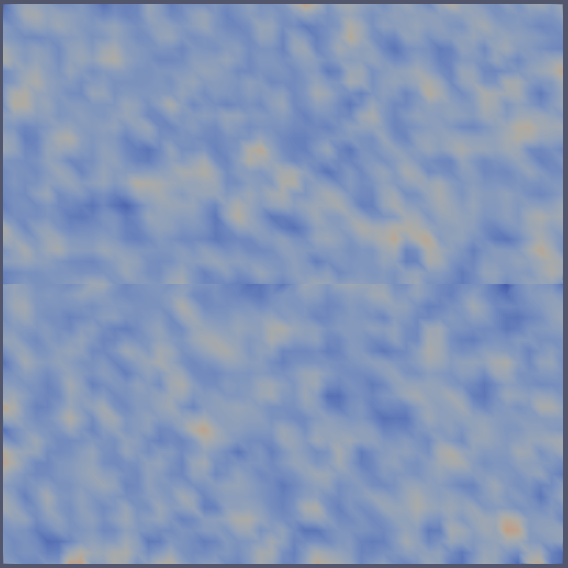
So I did a clip of both VTK files and used the AppendDatasets filter to append the datasets which looked fine until I applied the CellDatatoPointData filter. When I did so, the merged line becomes obvious and the filter is not interpolating across the lines it seems:
Is there another way? I also tried exporting the AppendedDatasets1 as a whole new VTK and retrying the CellDatatoPointData filter and the same issue persisted. This is the merged vtk: appended0.01.vtk (162.7 KB)