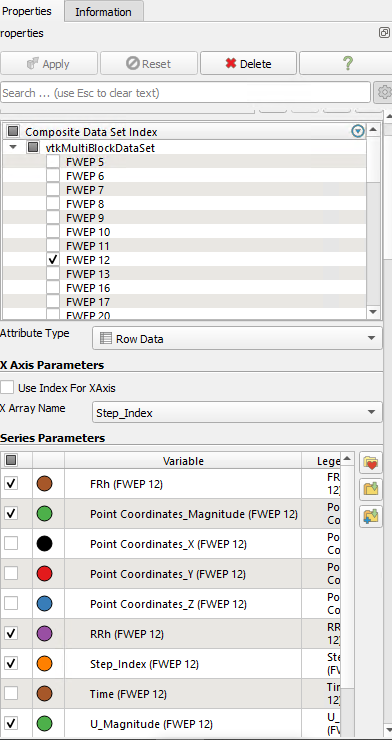
Well I cannot find how to change the defaults of the plot data filter in paraview so… I can only change the style options of some series only. I could do it by displaying all blocks and all the series and then change the style display for all of them (but that would mean around a thousands of series with 5000 times steps). .
Well that’s gonna take some computational time but if I have no choice…
To do that I need to go through all the names of the blocks in the multiblock dataset (because I don’t know these names in advance). Do you know how to do that?