Multi-dimensional netCDF file visualization

Hi,

I’m trying to use Paraview visualize multi-dimension netCDF data. But I noticed that the vtkNetcdfReader can’t take files that contain more than three dimensions(time included), and when I import my file on Windows version of Paraview 5.6, the program quitted unexpectedly, while on Linux version it gave errors like:

"ERROR: In /home/buildslave/dashboards/buildbot/paraview-pvbinsdash-linux-shared-release_superbuild/build/superbuild/paraview/src/VTK/IO/NetCDF/vtkNetCDFReader.cxx, line 803_
vtkNetCDFCFReader (0x61296d0): More than 3 dims without time not supported in variable LATD

ERROR: In /home/buildslave/dashboards/buildbot/paraview-pvbinsdash-linux-shared-release_superbuild/build/superbuild/paraview/src/VTK/Common/ExecutionModel/vtkExecutive.cxx, line 782
vtkPVCompositeDataPipeline (0x60d3780): Algorithm vtkFileSeriesReader(0x61302e0) returned failure for request: vtkInformation (0x5f1f5c0)
_ Debug: Off_
_ Modified Time: 316028_
_ Reference Count: 1_
_ Registered Events: (none)_
_ Request: REQUEST_DATA_
_ FROM_OUTPUT_PORT: 0_
_ ALGORITHM_AFTER_FORWARD: 1_
_ FORWARD_DIRECTION: 0_

Warning: In /home/buildslave/dashboards/buildbot/paraview-pvbinsdash-linux-shared-release_superbuild/build/superbuild/paraview/src/ParaViewCore/ClientServerCore/Rendering/vtkPVImageSliceMapper.cxx, line 146
vtkPVImageSliceMapper (0x6e4f2a0): Failed to locate selected scalars. Will use image scalars by default.

ERROR: In /home/buildslave/dashboards/buildbot/paraview-pvbinsdash-linux-shared-release_superbuild/build/superbuild/paraview/src/VTK/Rendering/OpenGL2/vtkOpenGLTexture.cxx, line 200
_vtkOpenGLTexture (0x6e4f6b0): No scalar values found for texture input!"

And here’re my questions:

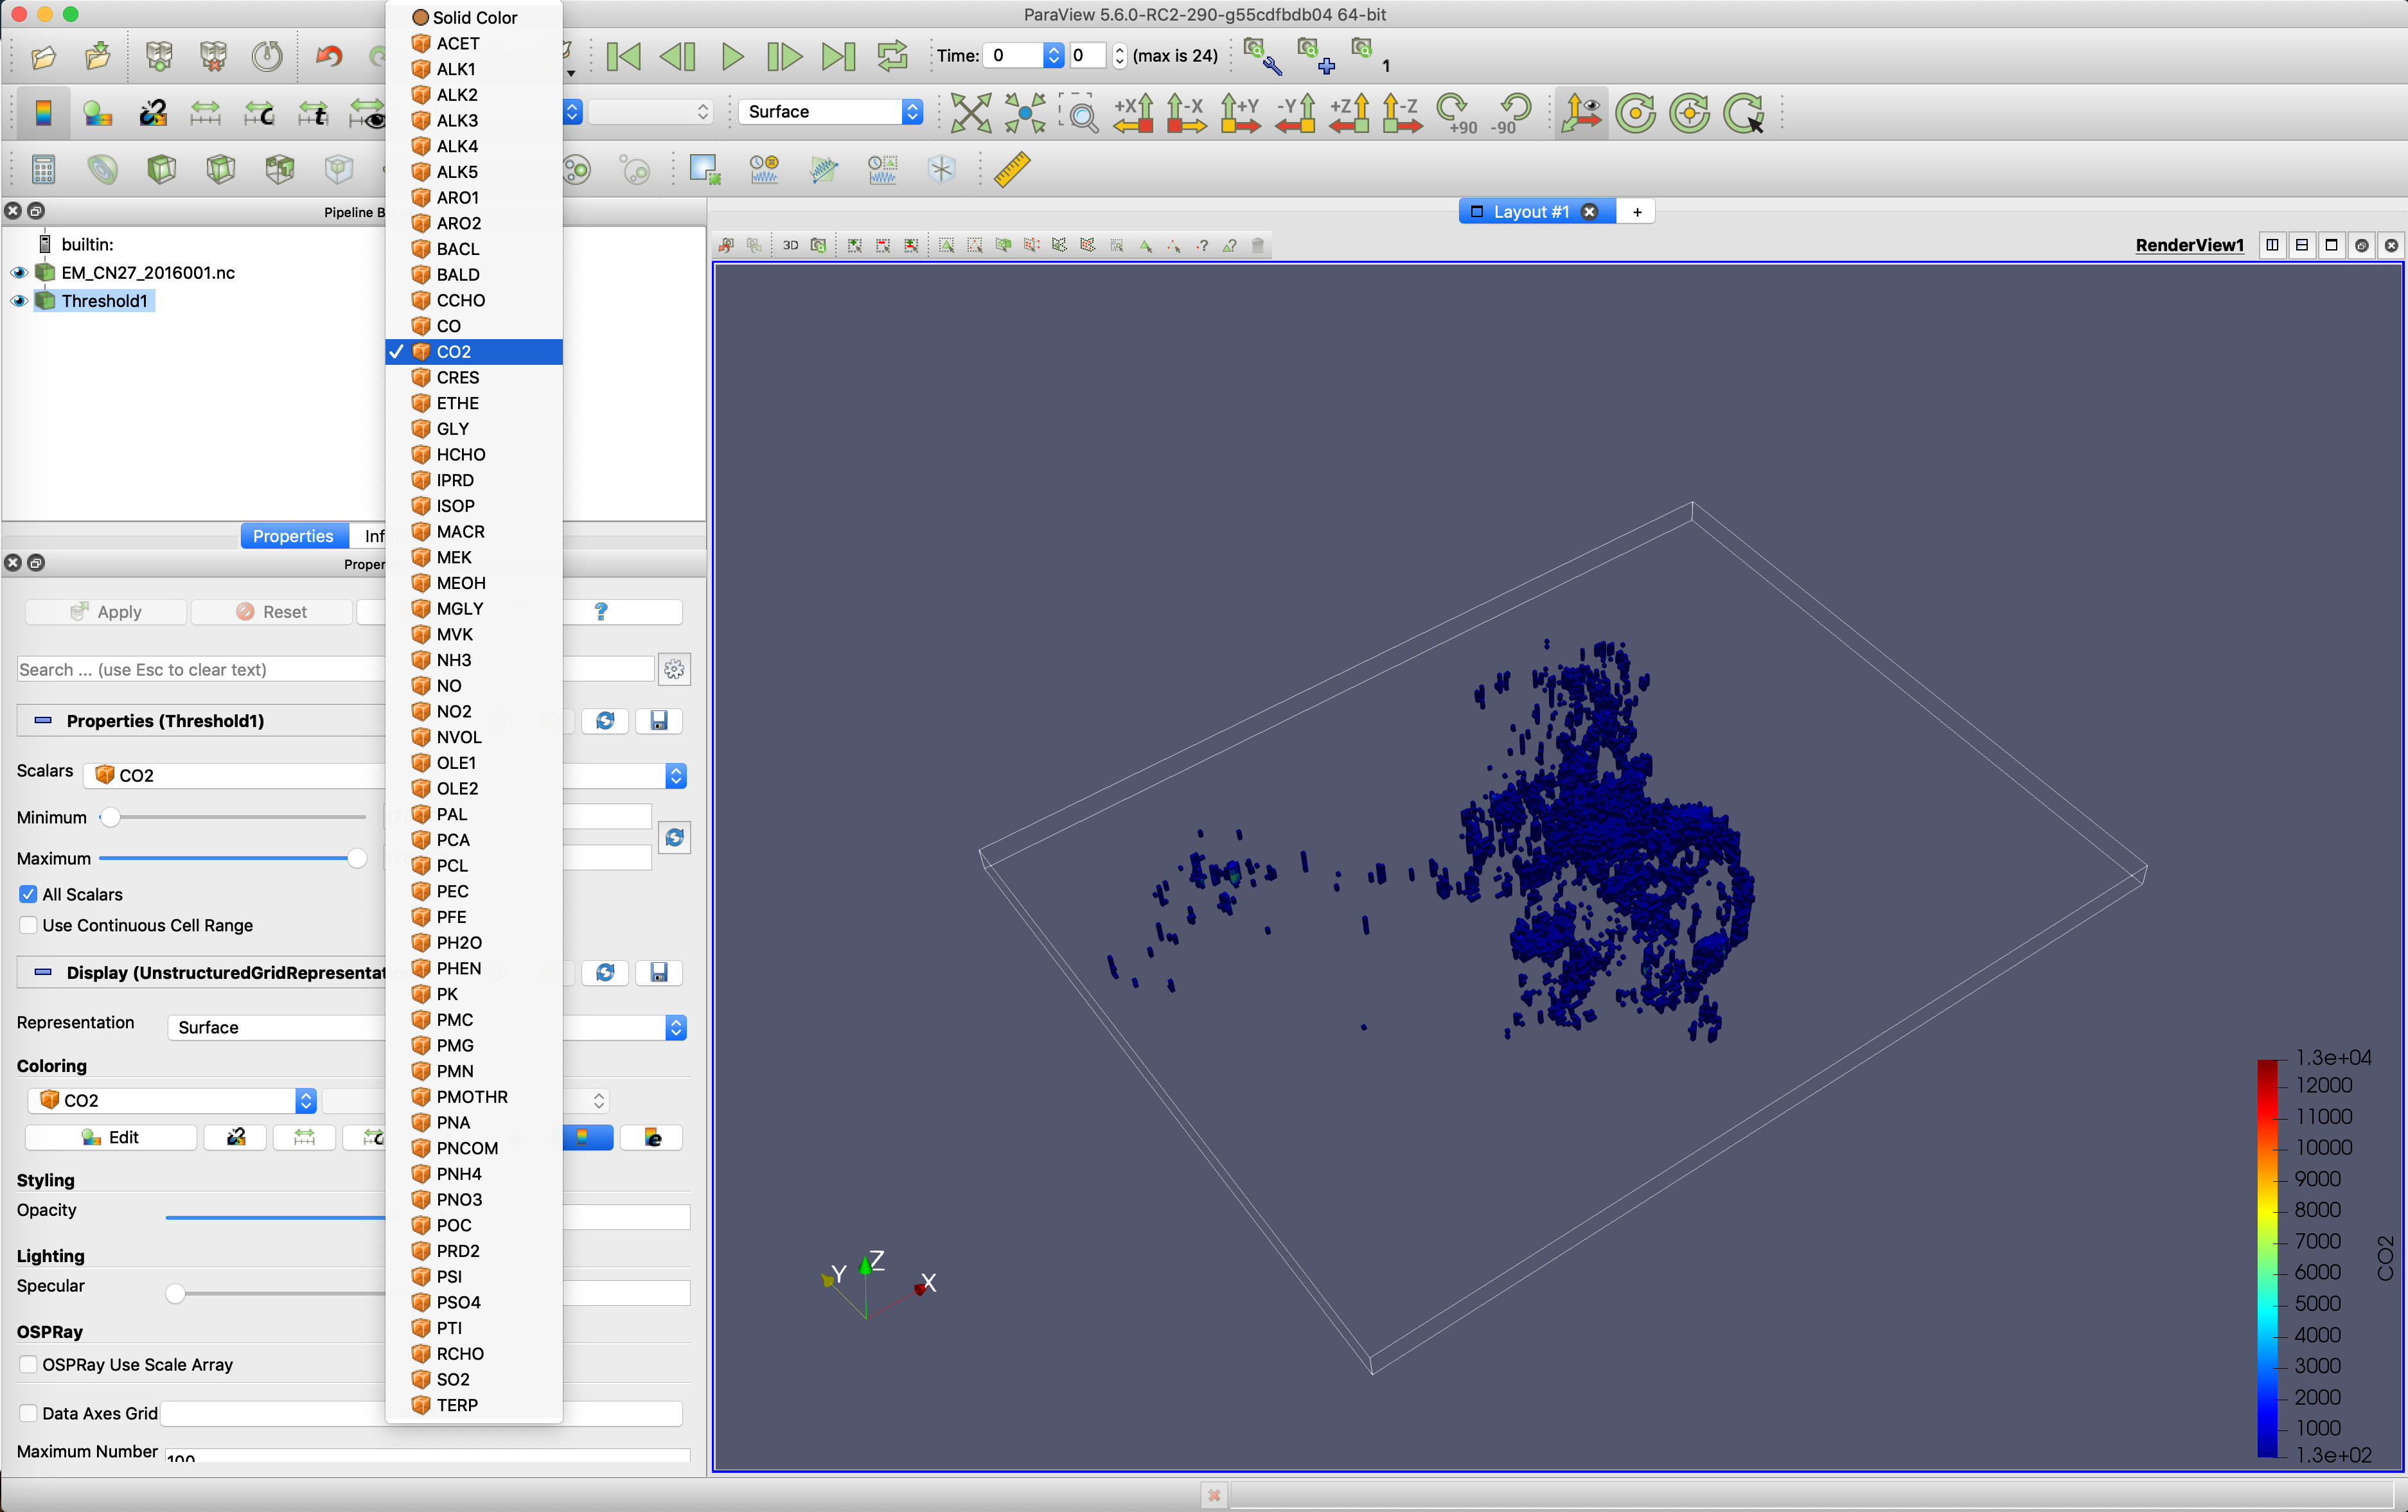
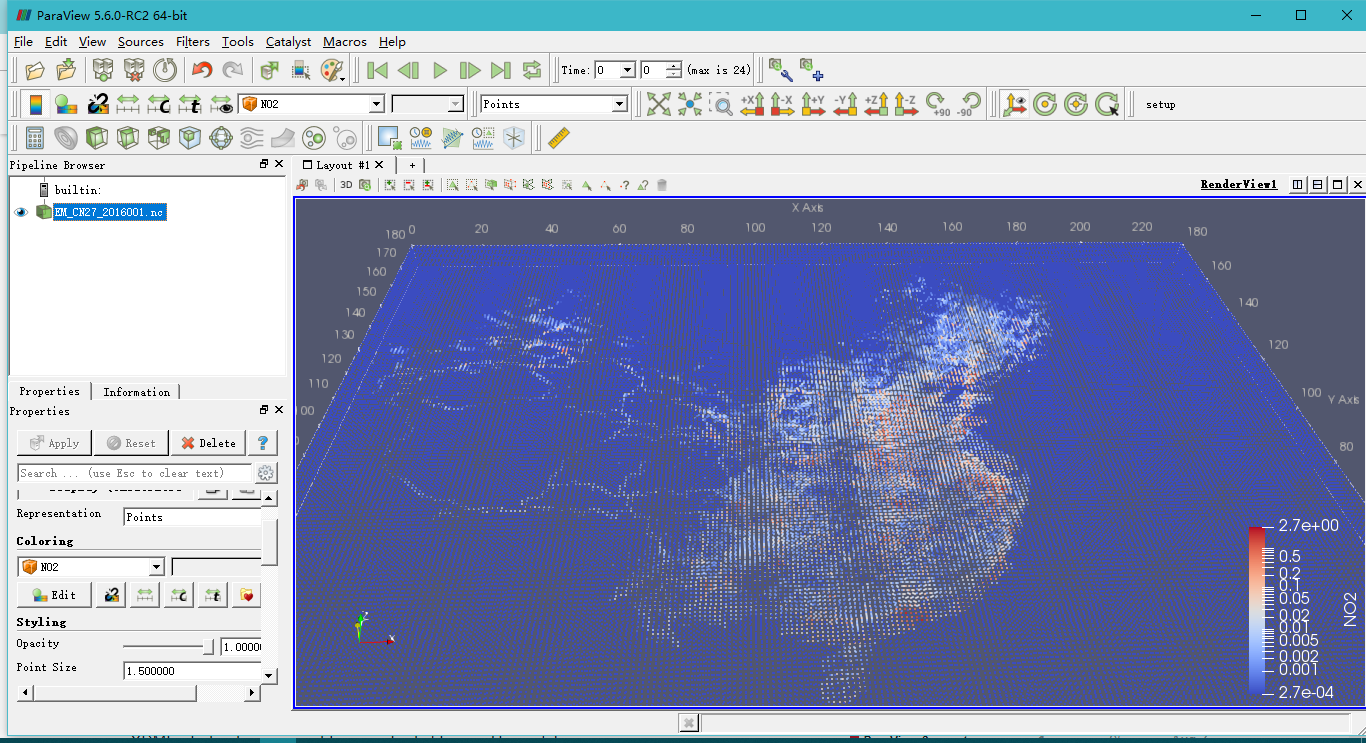
  1. Are there any other available packages or other readers that can handle multi-dimension netcdf data in Paraview? (And since the file format is applied to EPA CMAQ module, changing the file format is not an option)
  2. Current netcdf reader can’t select dimension when it reads more than three, is there any other way that can choose specific dimensions data to import?
    (Say now I have five dimensions: time, longitude, latitude, layers and pollutant concentration, can I just import longitude, latitude, and concentration?)

Just in case that you wanna try the netcdf file, I’ve uploaded here: https://drive.google.com/file/d/1UWYv6k4pBBiwMCa6HRAHoZL6UfX61_I8/view?usp=sharing

Hi @ZiweiWu,

I too work with netCDF4 and HDF5 files quite often and I have been working to develop a new set of Python-based plugins for reading these data formats directly into ParaView. This set of plugins is an offshoot of my PVGeo project called PVGeo-HDF5 which creates an easy to use framework for making a file reader for just about any data format in netCDF or HDF files.

So to anwser your questions:

  1. Yes! Checkout PVGeo-HDF5 (in very, very early stages of development). I used this to address another question here.
  2. I’m pretty sure you cannot do anything like this using ParaView’s native netCDF readers. But you could easily implement a reader in PVGeo-HDF to handle this.

Note: I see you are on Linux; PVGeo and PVGeo-HDF5 have an issue on Linux and requires users to build ParaView from source because of this issue

I could help you implement a simple reader for the CMAQ netCDF file format within PVGeo-HDF5 if you’re up for getting your hands dirty! I tried playing around with your sample file but I don’t really understand the format… There are these data arrays present but I don’t really understand the data array shapes (especially since the time array ('TFLAG' is all zeros):

<class 'netCDF4._netCDF4.Variable'>
int32 TFLAG(TSTEP, VAR, DATE-TIME)
    units: <YYYYDDD,HHMMSS>
    long_name: TFLAG           
    var_desc: Timestep-valid flags:  (1) YYYYDDD or (2) HHMMSS                                
unlimited dimensions: 
current shape = (1, 9, 2)
filling off

<class 'netCDF4._netCDF4.Variable'>
float32 LATD(TSTEP, LAY, ROW, COL)
    long_name: LATD            
    units: DEGREES         
    var_desc: latitude (south negative) -- dot point                                          
unlimited dimensions: 
current shape = (1, 1, 786, 973)
filling off

<class 'netCDF4._netCDF4.Variable'>
float32 LOND(TSTEP, LAY, ROW, COL)
    long_name: LOND            
    units: DEGREES         
    var_desc: longitude (west negative) -- dot point                                          
unlimited dimensions: 
current shape = (1, 1, 786, 973)
filling off

<class 'netCDF4._netCDF4.Variable'>
float32 MSFD2(TSTEP, LAY, ROW, COL)
    long_name: MSFD2           
    units: (M/M)**2        
    var_desc: squared map-scale factor (DOT)                                                  
unlimited dimensions: 
current shape = (1, 1, 786, 973)
filling off

<class 'netCDF4._netCDF4.Variable'>
float32 LATU(TSTEP, LAY, ROW, COL)
    long_name: LATU            
    units: DEGREES         
    var_desc: latitude (south negative) -- U face                                             
unlimited dimensions: 
current shape = (1, 1, 786, 973)
filling off

<class 'netCDF4._netCDF4.Variable'>
float32 LONU(TSTEP, LAY, ROW, COL)
    long_name: LONU            
    units: DEGREES         
    var_desc: longitude (west negative) -- U face                                             
unlimited dimensions: 
current shape = (1, 1, 786, 973)
filling off

<class 'netCDF4._netCDF4.Variable'>
float32 MSFU2(TSTEP, LAY, ROW, COL)
    long_name: MSFU2           
    units: (M/M)**2        
    var_desc: squared map-scale factor (U FACE)                                               
unlimited dimensions: 
current shape = (1, 1, 786, 973)
filling off

<class 'netCDF4._netCDF4.Variable'>
float32 LATV(TSTEP, LAY, ROW, COL)
    long_name: LATV            
    units: DEGREES         
    var_desc: latitude (south negative) -- V face                                             
unlimited dimensions: 
current shape = (1, 1, 786, 973)
filling off

<class 'netCDF4._netCDF4.Variable'>
float32 LONV(TSTEP, LAY, ROW, COL)
    long_name: LONV            
    units: DEGREES         
    var_desc: longitude (west negative) -- V face                                             
unlimited dimensions: 
current shape = (1, 1, 786, 973)
filling off

<class 'netCDF4._netCDF4.Variable'>
float32 MSFV2(TSTEP, LAY, ROW, COL)
    long_name: MSFV2           
    units: (M/M)**2        
    var_desc: squared map-scale factor (V FACE)                                               
unlimited dimensions: 
current shape = (1, 1, 786, 973)
filling off

Hi @ banesullivan,
Thanks for your reply! I’ve checked PVGeo-HDF5 and the question you addressed, this is quite close to what I need. I noticed that current code in PVGeo-HDF5 was still SVCParcelReader, and as I’m not familiar with the file format that Kelton used, I don’t know how to change the code so that it can match my format. It would be terrific if you can help me implement this reader!

File that I uploaded last time was just for experiment, and the file structure in real one should look like this:
It has 6 dimensions as:

OrderedDict([
(u’TSTEP’, <type ‘netCDF4._netCDF4.Dimension’> (unlimited): name = ‘TSTEP’, size = 25
), (u’DATE-TIME’, <type ‘netCDF4._netCDF4.Dimension’>: name = ‘DATE-TIME’, size = 2
), (u’LAY’, <type ‘netCDF4._netCDF4.Dimension’>: name = ‘LAY’, size = 7
), (u’VAR’, <type ‘netCDF4._netCDF4.Dimension’>: name = ‘VAR’, size = 54
), (u’ROW’, <type ‘netCDF4._netCDF4.Dimension’>: name = ‘ROW’, size = 182
), (u’COL’, <type ‘netCDF4._netCDF4.Dimension’>: name = ‘COL’, size = 232
)])
Note: The ‘TSTEP’ is time dimension ranges from 0-24; ‘COL’, ‘ROW’ and ‘LAY’ are like the x,y,z dimension; the ‘VAR’(numbers of pollutant species) and ‘DATE-TIME’(const) are irrelevant.

And the file contains 55 variables in total. The first one is ‘TSTEP’, of shape (25, 54, 2); and the others are 54 pollutants’ concentration, each one is of shape (25, 7, 182, 232).

So, what I wanna achieve here is very similar to what you did in Kelton’s questions: read the file and build a visualization of concentration(single pollutant, say NO2) to dimensions of time, col, row, layer. Or if I can choose which pollutant to visualize in the properties menu would be perfect.

I’ve uploaded detailed file structure and a file (kinda big but the smallest I can find…) which you may need to experiment on here:
https://drive.google.com/drive/folders/1IxVfQrCyppwnI3QLdQw5_3P3cMwPHoZg?usp=sharing

Really appreciate your help!

Best,
Ziwei Wu

Check out the code I just pushed to PVGeo-HDF5. Note that for any new netCDF reader, you will have to fill out _ReadUpFront(), _GetRawData(), and RequestData() so that it handles your netCDF file’s structure.

Here’s the result in ParaView. It’s​ a rough prototype that could use some cleaning up, but it works. Note that it yields the 25 timesteps!

Looks great! But how should I add this reader to paraview? (I tried to run the setup.py then use the plugin manager to import PVGeo_HDF_All.py but it didn’t work.)

@ZiweiWu, ah yes, PVGeo-HDF5 has a number of dependencies that need to be seen by ParaView. You will have to install it in the same manner as PVGeo. See PVGeo’s instructions here and if you I have any trouble, join PVGeo’ Slack and message me there!

We have automated installation scripts for windows and Mac but not Linux so definitely let me know on Slack if there is an issue.

Note that if you don’t want to install PVGeo fully, then you can just set your PYTHONPATH variable to the site-packages where you installed PVGeo-HDF5 as long as it was in Python 2.7

Works perfect. Thanks again for your help, I’ll keep you noticed if I got any further development based on your reader, Cheers!

1 Like

AWESOME!!! Definitely feel free to fork pvgeohdf and/or create merge requests or feature requests!

Hello, I am interested to know if this library could handle nemo netcdf files (not necessarily as it is), that are outputs of oceanographic simulations. Netcdf reader of Paraview 5.8/5.9/5.10 can not open them (Incorrect dimensionality).

a sample of this dataset can be found here : Catalog Services

Really appreciate any feedback.

Best regards,
JB

I’m afraid it looks like it is not. It could be improved but that would require deeper investigation.

Okay. May I ask what approach you could suggest to me?
I have read that transforming netcdf files to HDf5 format with a python script could be useful. As our team is just starting with parview and ocean data (but training with the kitware team is planned very soon), I want to make sure I’m not missing anything before I code something from scratch.
Thanks.