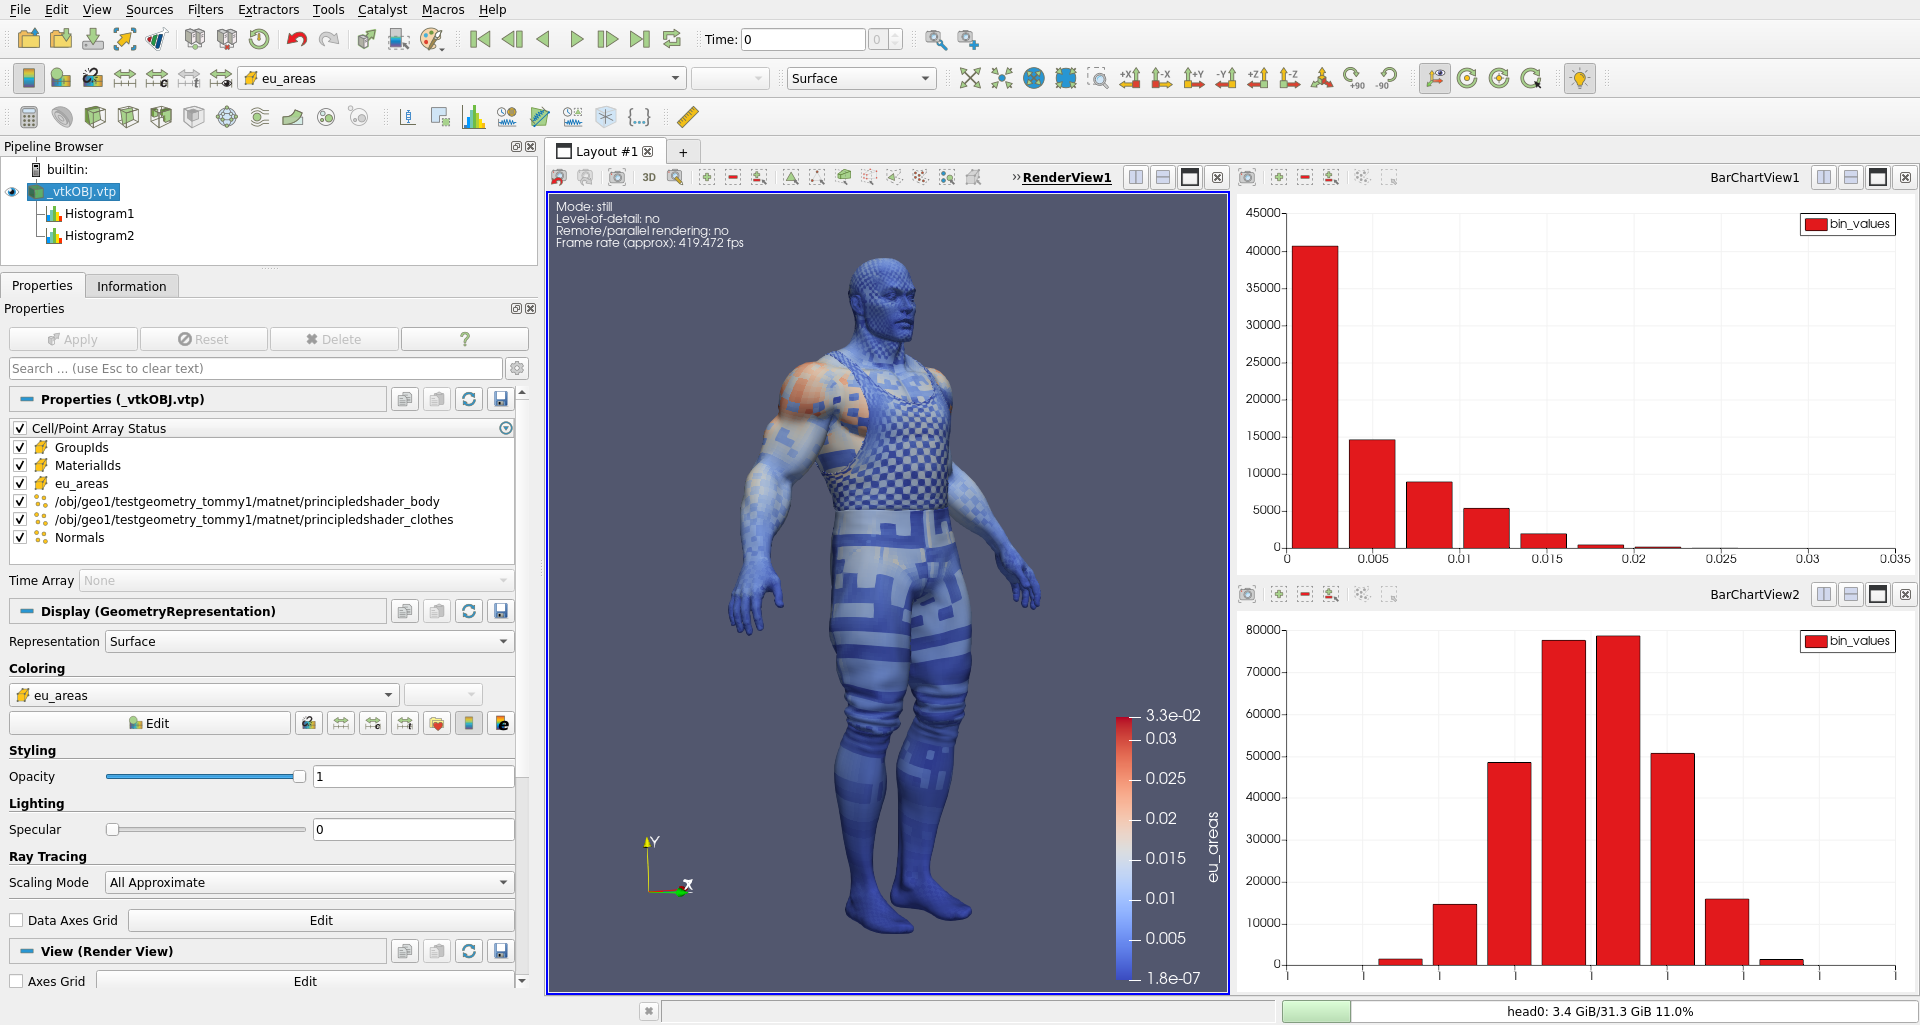
I plot the histogram of 2 scalars and they end up in the same graph. I would like to have them on separate graph. Is that possible ?
For separate graphs, split your view, create a Bar Chart View (with these buttons ![]() ). Make the second Histogram visible in it, and make only the first Histogram visible in your first Bar Chart View.
). Make the second Histogram visible in it, and make only the first Histogram visible in your first Bar Chart View.
Thank you @mwestphal and @cory.quammen , got it working