My Cp Plot: Where have I gone wrong?

Hi everyone,

I have been struggling to get a Coefficient of pressure plot vs distance along x for some time.

Each time I get this graph which you can see above.

Could anyone suggest where I am going wrong?

I am working in simscale so here is the project if you need to refer. https://www.simscale.com/workbench/?pid=8358583334176883640&rru=3b68d092-4955-4d43-a17f-ca908f2ae283&ci=a3a6b064-57d1-4166-9a0b-4b04f67f2483&ct=PLOT&mt=SIMULATION_RESULT .

I would appreciate any help or suggestions.

Thank you,
Pippa

Please share an example of your data.

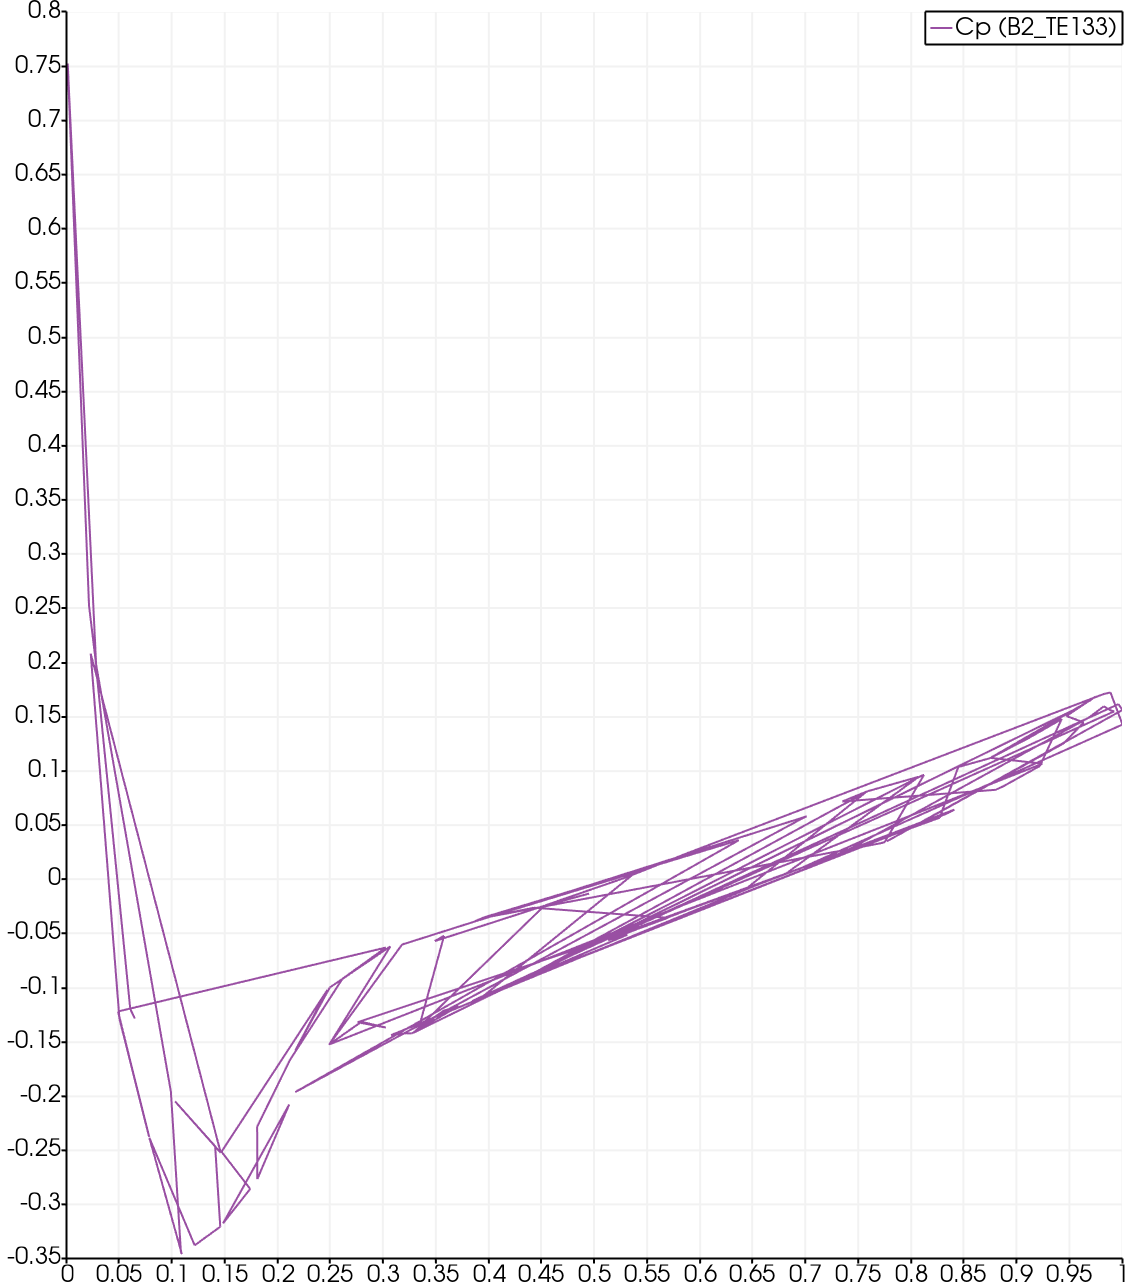
In addition to an example of your data, it is also helpful for information on the steps you are taking in ParaView. Are you using the Plot Over Line filter (as is customary to plot a variable for distance) or do you have a data set with a bunch distance/coefficient pairs? From the example graph you gave, it sounds like the distance comes from some source other than Plot Over Line. The data are not given in distance order, so ParaView is connecting lines back and forth in the order in which the data are listed.

1 Like

I have tried to attach my data in a zip file but it would not upload for some reason. In the link above I have my simscale data in solution field

.Screenshot 2020-04-06 at 16.23.10

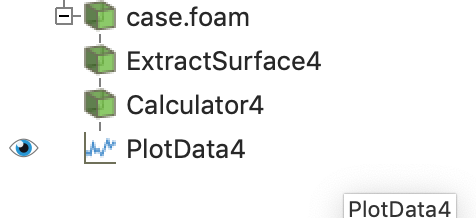
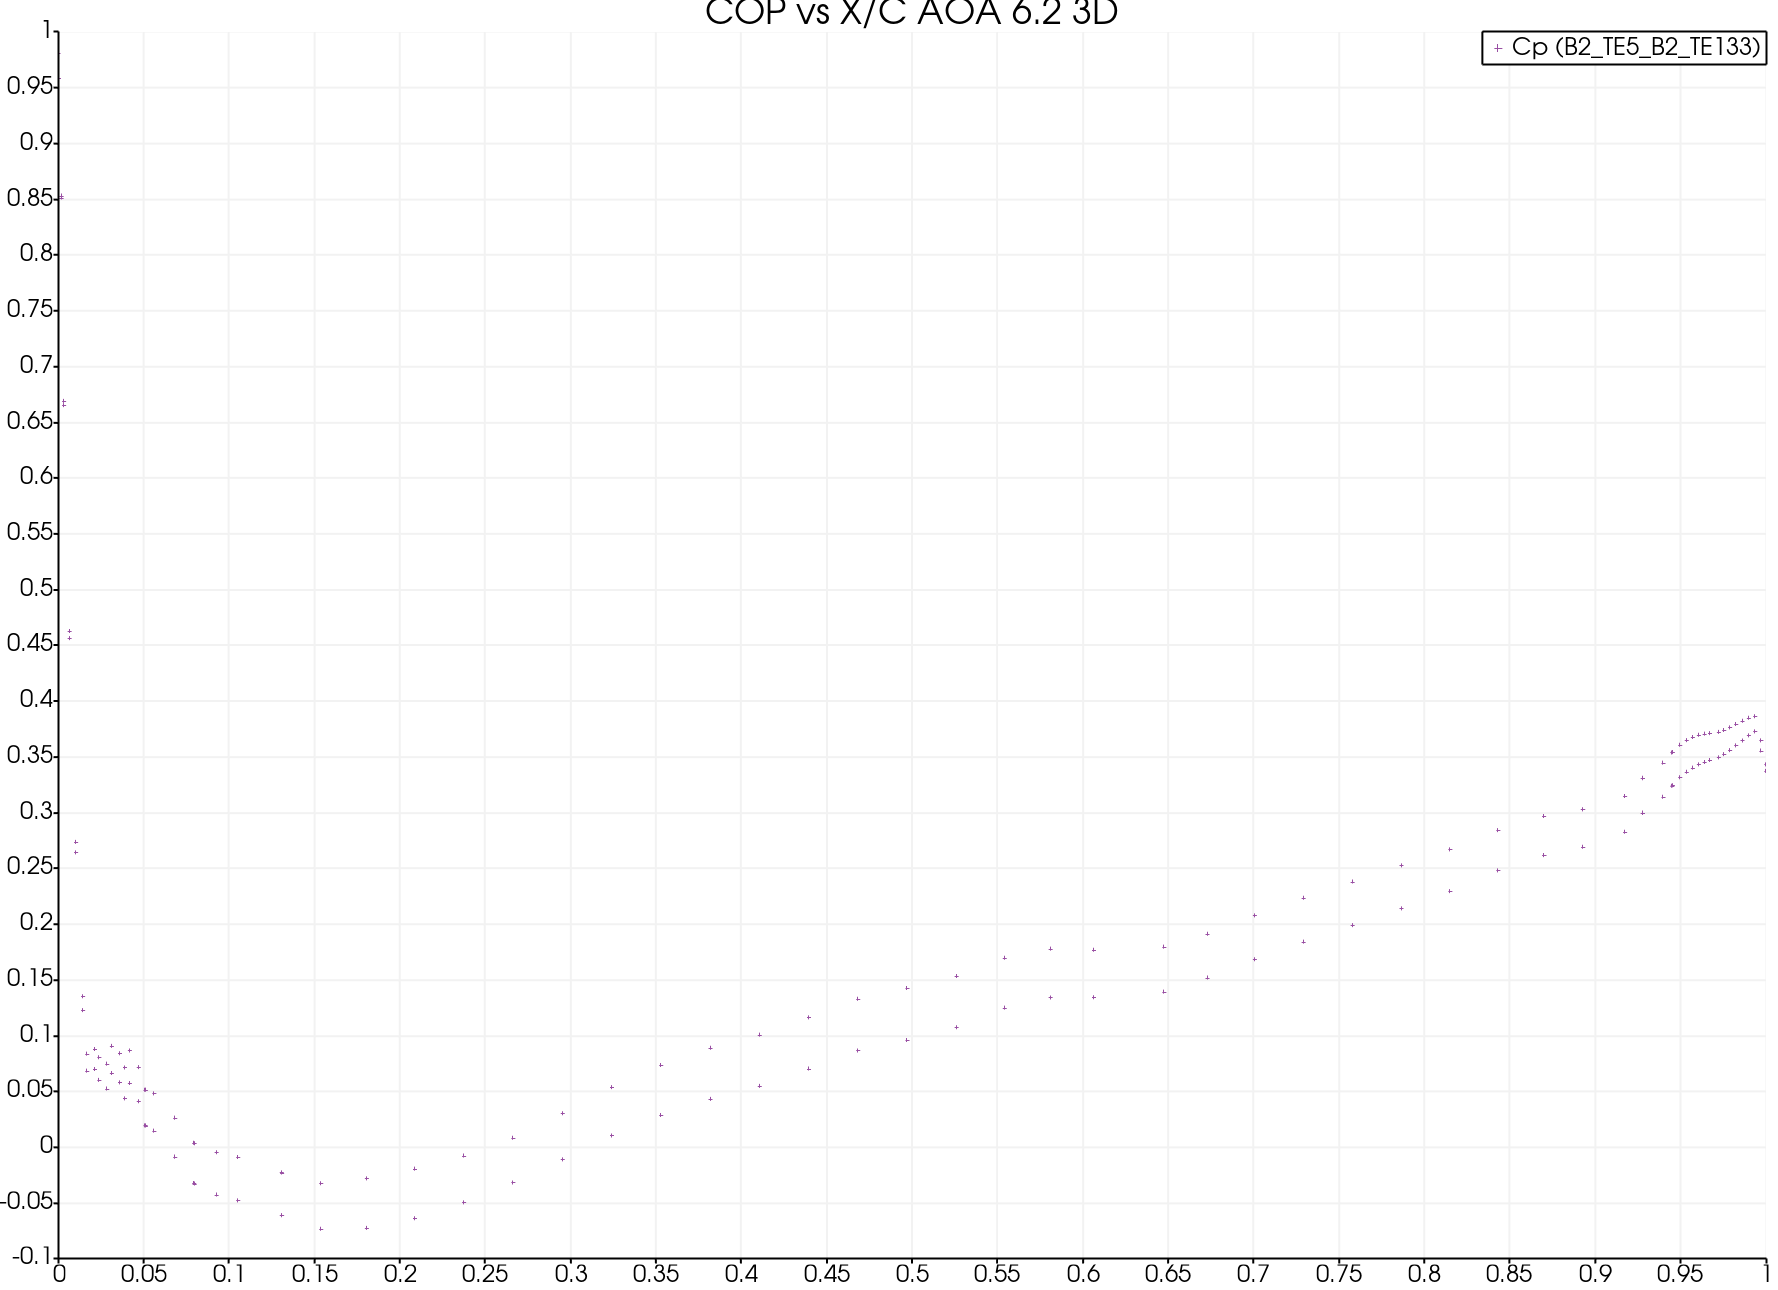
This is an attachment for my 3D wing at AOA of 6.2. This is what I am getting at the moment. I dont have the lines anymore as I plotted as points but the data is looking very off and I’m not sure why. I am using Plot Data and creating the lines first and then creating the points.

Thank you both for the help

Can’t really help you without data. If you can’t share it on discourse, use a service like WeTransfer please.

please share also a statefile.

File -> Save State.

Those are the two files…


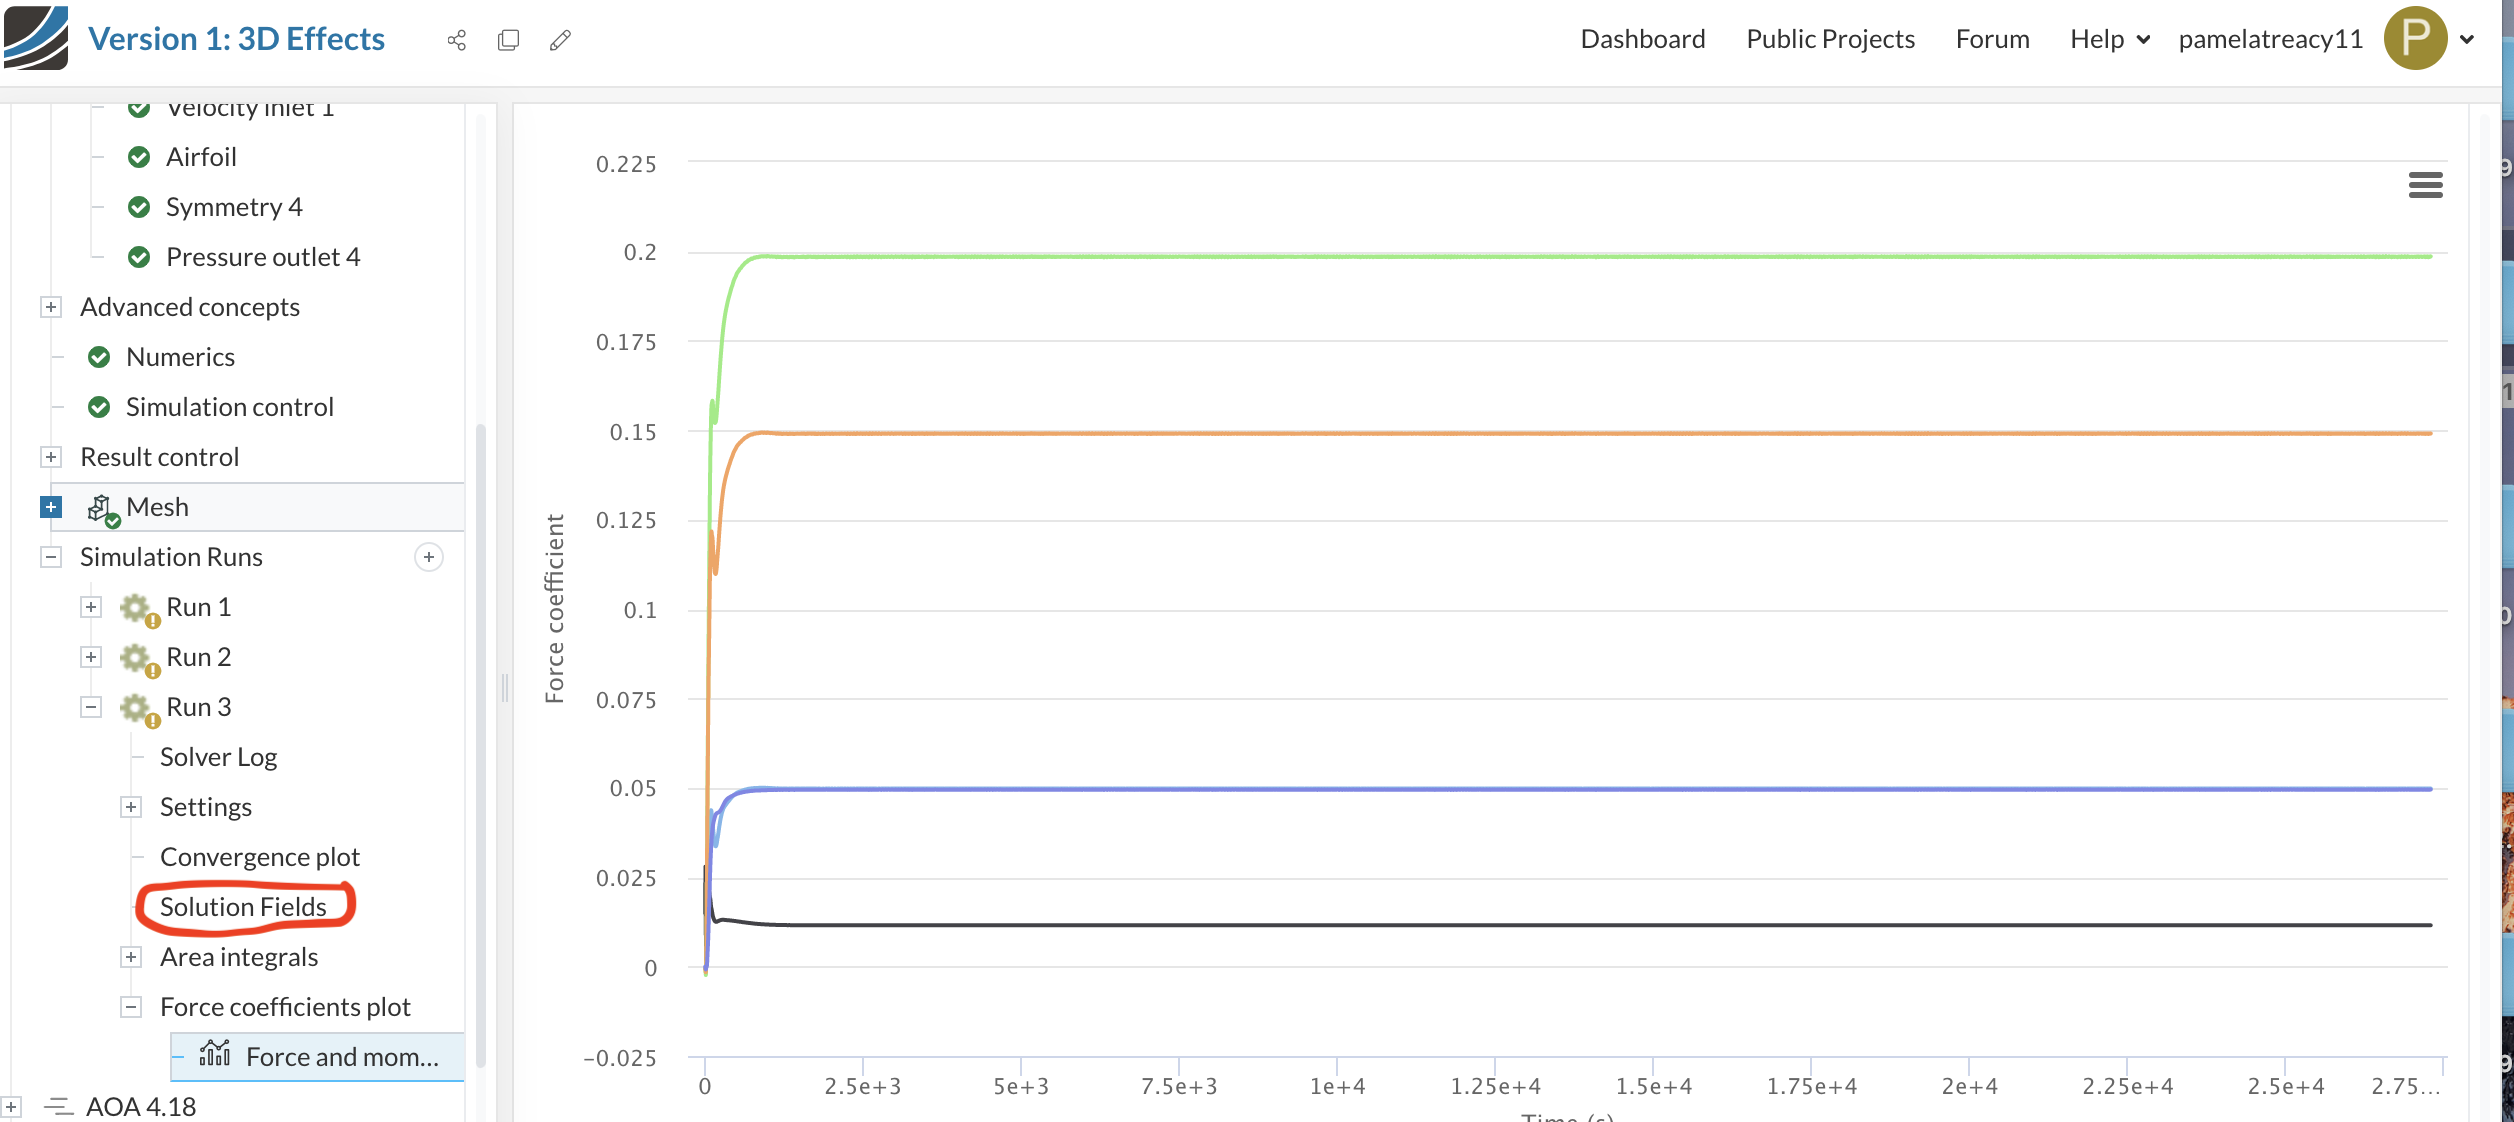
This occurs with any 3D data that I produce even if the experimental results are equating to the coefficient of lift and drag I get in the solver log. I can plot 2D results fine in ParaView.

Line in a chart view are plotted in the order of the data. This order does not mean anything as it come from the indexing of the points.

As @Kenneth_Moreland stated, You want to use something like PlotOverLine instead of Plot Data.
Reread his message, all you need is there.