Need Help with Visualizing Von Mises Stress in a VTP File using vtk.js and React

Hello,

I am currently working on a project where I am using Kitware’s vtk.js library to visualise my VTP files in a React application. So far, I have been able to successfully load and display the VTP file. However, I am facing some challenges when it comes to visualising the Von Mises stress for my VTP file.

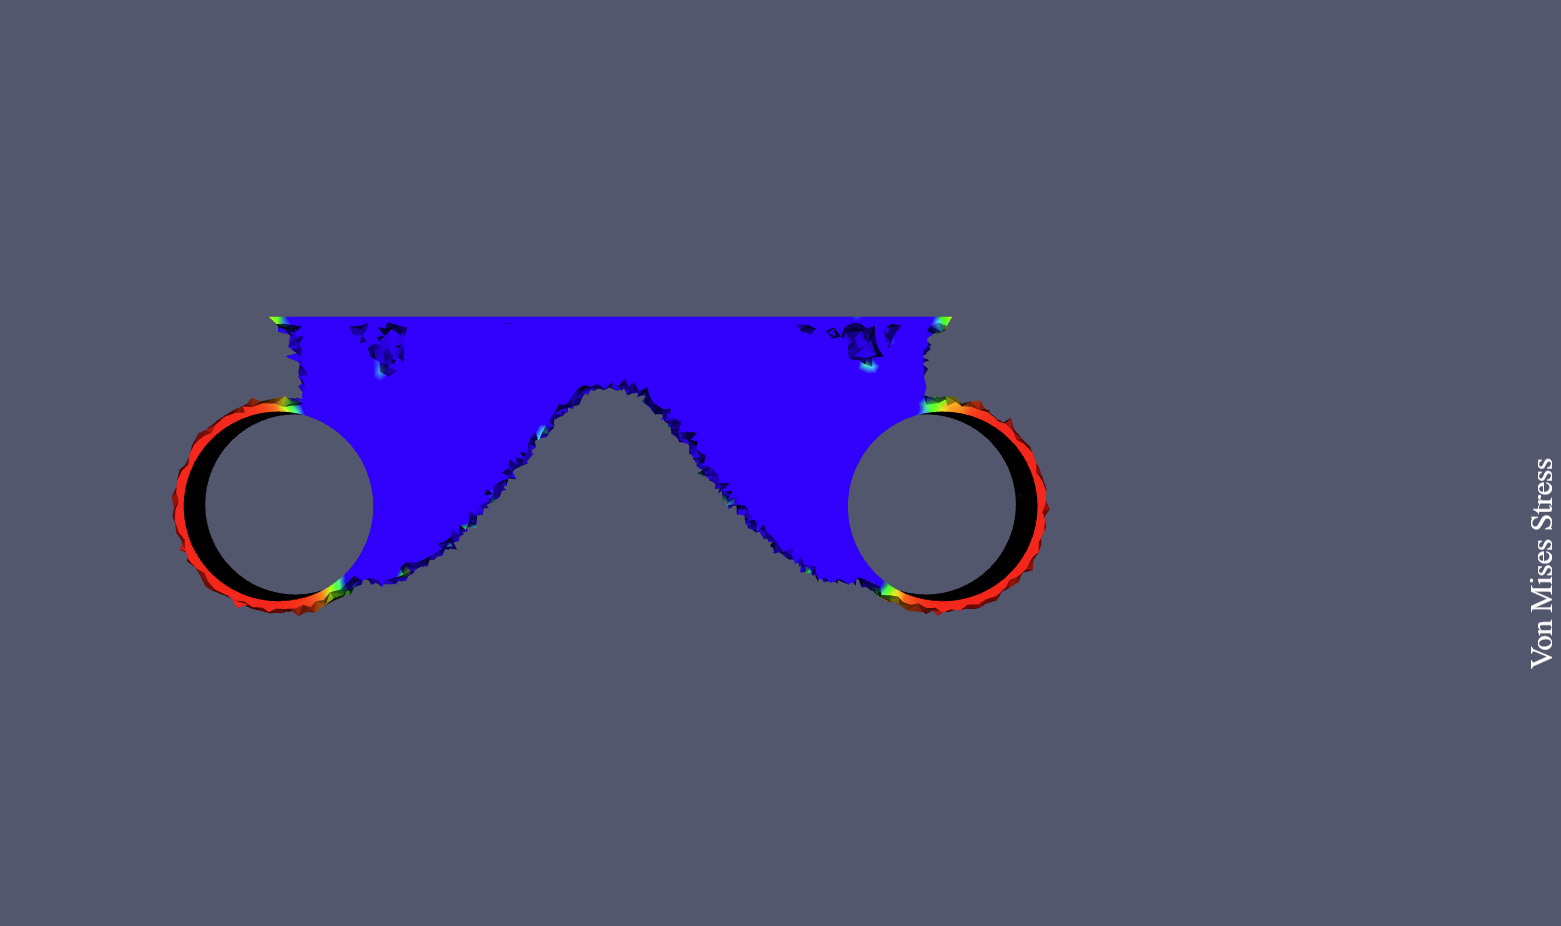
I have attached an image below to give you an idea of what I am currently able to visualise and what I aim to achieve. As you can see, I want to add a colour map to represent the Von Mises stress distribution.

I would greatly appreciate it if anyone could guide me on how to achieve this in React using vtk.js. Any pointers, code snippets, or references to relevant documentation would be extremely helpful.

Thank you in advance for your time and assistance.
Regards,
Godric.


It seems that you need to select the array you want to color by. You can look at the geometry example on how to select an array to color by.

Thank you for your previous response. I checked the example you mentioned and was able to color the array and add a scalarBar to my viewer. However, I am encountering an issue.

When I create a look-up table and add it to my mapper, my model is not visible in the viewer. Conversely, when I don’t add the look-up table in the mapper and add it in the scalar Bar, I don’t see the color range in the viewer. With the below code I am not getting range for the array too. I have attached images of both behaviors for reference. Here is my code

function VTKViewer() {
  const vtkContainerRef = useRef(null);
  const context = useRef(null);
  const [representation, setRepresentation] = useState(2);

  useEffect(() => {
    if (!context.current) {
      const fullScreenRenderer = vtkFullScreenRenderWindow.newInstance({
        rootContainer: vtkContainerRef.current,
      });

      const reader = vtkXMLPolyDataReader.newInstance();

      reader
        .setUrl("assets/file089_state1.vtp", { loadData: true })
        .then(() => {
          const output = reader.getOutputData(0);
          const scalars = output.getPointData().getScalars();
          const dataRange = [].concat(scalars ? scalars.getRange() : [0, 1]);

          let activeArray = vtkDataArray;
          const location = "PointData";
          const colorByArrayName = "S";
          const newArray =
            output[`get${location}`]().getArrayByName(colorByArrayName);
          activeArray = newArray;
          const newDataRange = activeArray.getRange();
          dataRange[0] = newDataRange[0];
          dataRange[1] = newDataRange[1];

          const lookupTable = vtkColorTransferFunction.newInstance();
          lookupTable.setMappingRange(dataRange[0], dataRange[1]);
          lookupTable.updateRange();

          const mapper = vtkMapper.newInstance();
          mapper.set({
            colorByArrayName,
            colorMode: ColorMode.MAP_SCALARS,
            interpolateScalarsBeforeMapping: false,
            scalarMode: ScalarMode.USE_POINT_FIELD_DATA,
            scalarVisibility: true,
          });

          mapper.setInputData(output);

          let lut = mapper.getLookupTable();
          lut.setRange(dataRange[0], dataRange[1]);
          lut.setVectorModeToMagnitude();

          const actor = vtkActor.newInstance();
          actor.setMapper(mapper);

          const scalarBarActor = vtkScalarBarActor.newInstance();
          scalarBarActor.setScalarsToColors(lut);
          scalarBarActor.setDrawNanAnnotation(false);
          scalarBarActor.setAxisLabel("Von Mises Stress");
          scalarBarActor.setVisibility(true);

          const renderer = fullScreenRenderer.getRenderer();
          const renderWindow = fullScreenRenderer.getRenderWindow();

          renderer.addActor(scalarBarActor);
          renderer.addActor(actor);
          renderer.resetCamera();
          renderWindow.render();

          context.current = {
            fullScreenRenderer,
            renderWindow,
            renderer,
            actor,
            mapper,
          };
        });
    }

    return () => {
      if (context.current) {
        const { fullScreenRenderer, actor, mapper } = context.current;
        actor.delete();
        mapper.delete();
        fullScreenRenderer.delete();
        context.current = null;
      }
    };
  }, [vtkContainerRef]);

  useEffect(() => {
    if (context.current) {
      const { actor, renderWindow } = context.current;
      actor.getProperty().setRepresentation(representation);
      renderWindow.render();
    }
  }, [representation]);

  return (
    <div>
      <div ref={vtkContainerRef} />
      <table
        style={{
          position: "absolute",
          top: "25px",
          left: "25px",
          background: "white",
          padding: "12px",
        }}
      >
        <tbody>
          <tr>
            <td>
              <select
                value={representation}
                style={{ width: "100%" }}
                onChange={(ev) => setRepresentation(Number(ev.target.value))}
              >
                <option value="0">Points</option>
                <option value="1">Wireframe</option>
                <option value="2">Surface</option>
              </select>
            </td>
          </tr>
        </tbody>
      </table>
    </div>
  );
}

Could you please help me understand what I might be doing wrong?
Also, could you advise which array I should use to display von Mises stress?


You didn’t set any color to your vtkColorTransferFunction.

Did you try to load your VTK in the Geometry example to see if you can look at your data? Can you pick the proper array and render things correctly?

Also your code is strange, you are creating object that you don’t use and calling method by building its name from string.

Thank you for the help. After setting the color, the issue was resolved. Also, I loaded my VTP file in the Geometry Example and was able to view my data.